

Ethereum Price Pulls Back Hard, Bitcoin Crash Fuels Bearish Wave
Ethereum price started a fresh decline from the $4,950 zone. ETH is now trading below $4,550 and shows bearish signs similar to Bitcoin.
- Ethereum started a fresh decline after it traded to a new all-time high.
- The price is trading below $4,550 and the 100-hourly Simple Moving Average.
- There is a key bearish trend line forming with resistance at $4,510 on the hourly chart of ETH/USD (data feed via Kraken).
- The pair could start another increase unless there is a close below $4,250 in the near term.
Ethereum Price Corrects Gains
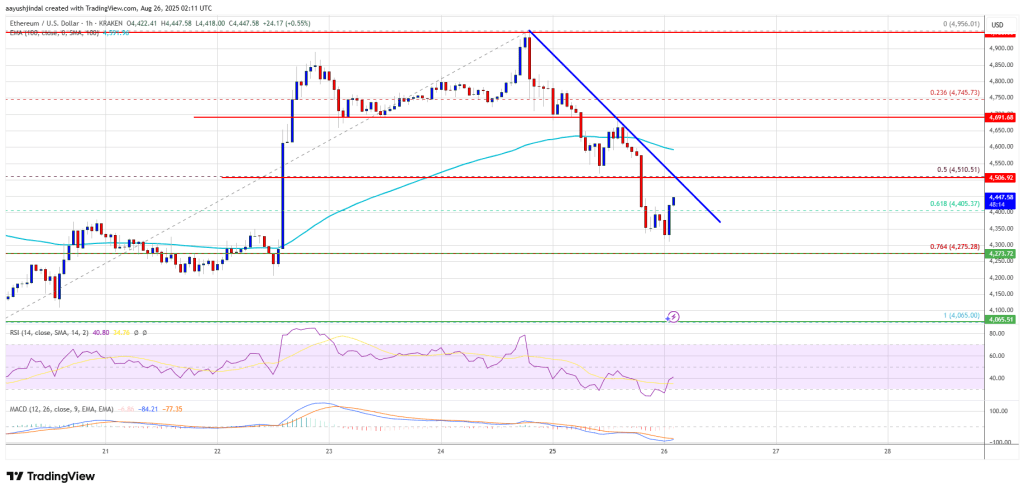
Ethereum price traded to a new all-time high above the $4,950 level before the bears appeared, unlike Bitcoin. ETH price started a downside correction below the $4,800 and $4,750 levels.
There was a move below the $4,650 support. The price dipped below the 50% Fib retracement level of the upward move from the $4,065 swing low to the $4,956 high. Besides, there is a key bearish trend line forming with resistance at $4,510 on the hourly chart of ETH/USD.
Ethereum price is now trading below $4,550 and the 100-hourly Simple Moving Average. On the upside, the price could face resistance near the $4,500 level and the trend line. The next key resistance is near the $4,550 level.
The first major resistance is near the $4,620 level. A clear move above the $4,620 resistance might send the price toward the $4,750 resistance. An upside break above the $4,750 resistance might call for more gains in the coming sessions. In the stated case, Ether could rise toward the $4,880 resistance zone or even $5,000 in the near term.
Another Drop In ETH?
If Ethereum fails to clear the $4,550 resistance, it could continue to move down. Initial support on the downside is near the $4,350 level. The first major support sits near the $4,280 zone and the 76.4% Fib retracement level of the upward move from the $4,065 swing low to the $4,956 high.
A clear move below the $4,280 support might push the price toward the $4,150 support. Any more losses might send the price toward the $4,120 support level in the near term. The next key support sits at $4,065.
Technical Indicators
Hourly MACD – The MACD for ETH/USD is losing momentum in the bullish zone.
Hourly RSI – The RSI for ETH/USD is now below the 50 zone.
Major Support Level – $4,280
Major Resistance Level – $4,550


추천 콘텐츠

Critical USDT0 Response to Drift Hack Exposes Stark Contrast in Stablecoin Security Protocols

Elon Musk Loses $134B Lawsuit Against OpenAI & Sam Altman


