

Will the DOT Price Chart Lead to a $10 Target in 2025?

The post Will the DOT Price Chart Lead to a $10 Target in 2025? appeared first on Coinpedia Fintech News
The DOT price is drawing attention after showing signs of strength against key levels, underlined by experts. As momentum is building, now traders are pointing towards breakout patterns on both short and long-term DOT crypto charts.
Therefore, experts are forecasting on all major time frames that if bullish volume explodes, then there are much higher odds that the Polkadot token might challenge upside ranges, making it an asset must have in the critical watch list for the coming weeks.
DOT Price Gains Strength & Symmetrical Triangle Breakout in Sight
The DOT price today stands at $3.77, backed by a $6.10 billion market cap and $307.28 million in daily trading volume.
 Source: X
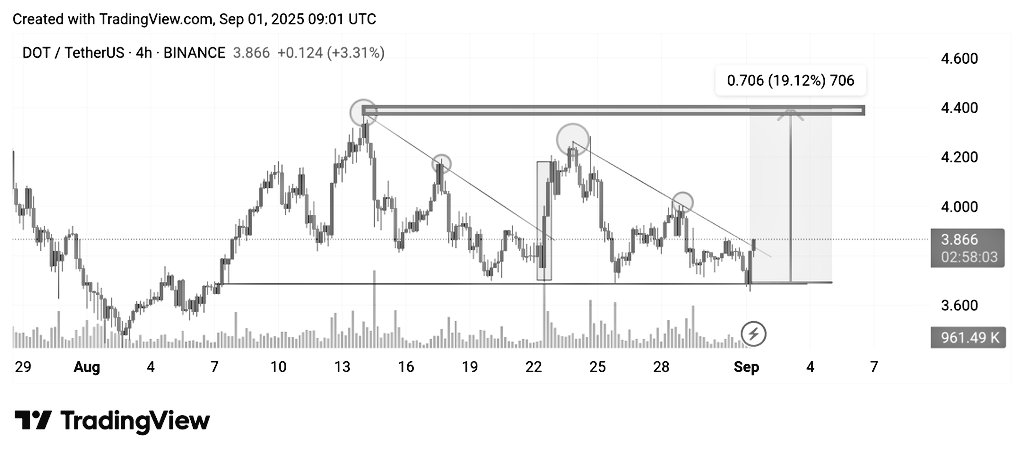
A recent analysis by an expert on X, the 4-hour Polkadot price chart has revealed that the token has broken above a falling trendline, hinting at a near-term rally.
One bullish setup on the 4-H chart strongly suggests that an immediate target around $4.40 is likely in the short term this September, which could display a potential 19% gain if momentum sustains.
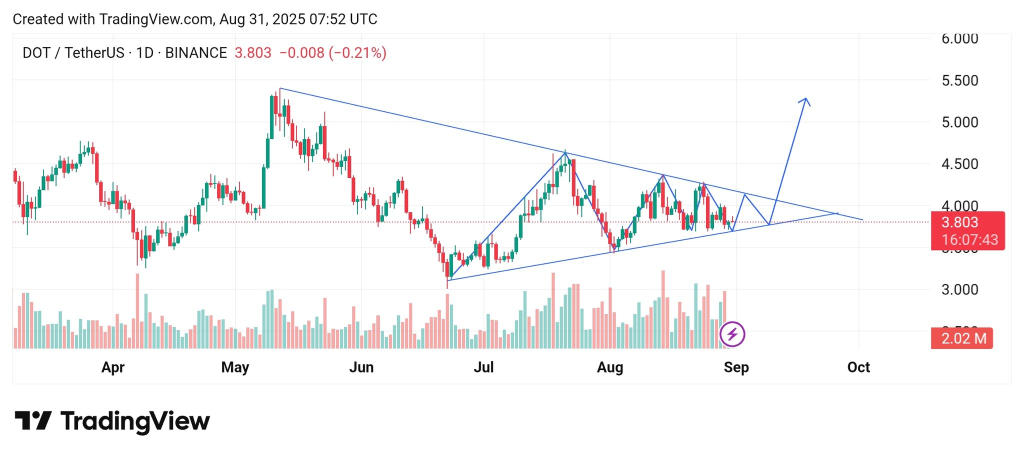
Similarly, on the daily chart, the DOT crypto is also building pressure inside a symmetrical triangle formation, according to another analyst’s theory.
Rising trading volume adds weight to the possibility of an upside breakout from this pattern.
Therefore, the analyst strongly believes that if this pattern plays out in the upcoming daily sessions, then the projections suggest that the DOT/USD could climb to $5.50 in September, with a broader DOT price prediction targeting the $10 mark before the end of 2025.
 Source: X
Polkadot’s Long-Term Potential and ATH Revisit
The short-term narrative is bullish, and beyond short-term moves, the Polkadot price forecast narrative stretches further on the bullish angle.
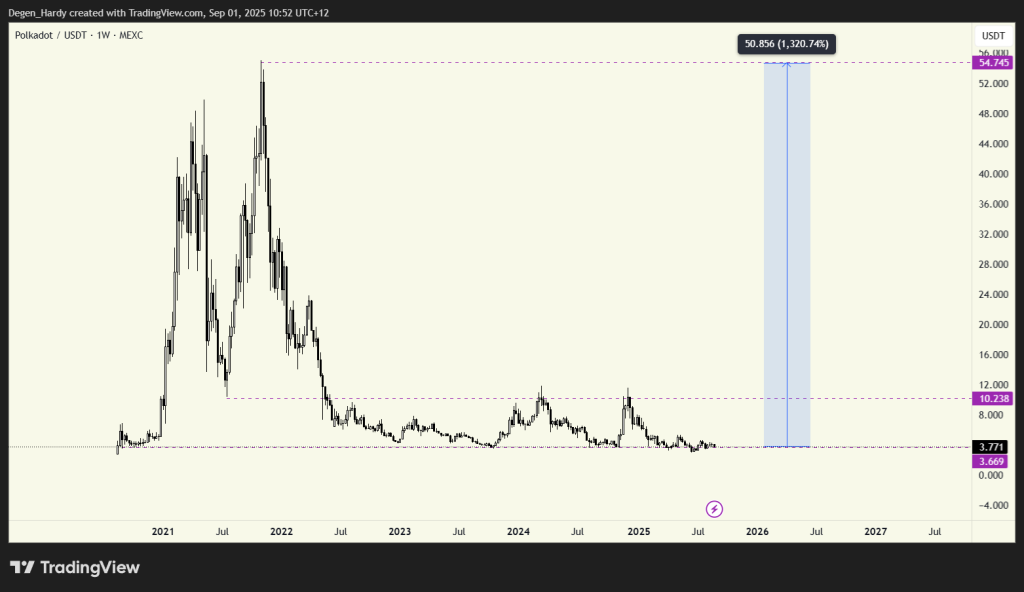
An ambitious Analyst posted a weekly time frame chart analysis in which he highlighted that DOT crypto remains undervalued compared to its previous cycle peak.
In late 2021, the DOT price USD touched $54, but now it trades much lower, despite its strong fundamentals and use case.
Some traders now believe that if accumulation continues, an ATH retest could be on the table by the first half of 2026.
 source: X


추천 콘텐츠

AI predicts XRP price for April 30, 2026

Justice Department has 'gone off the rails' for Trump's 'pretzel logic': analysis


