One Slip And Dogecoin Could Plunge Back Into A Bear Market: Analyst
The Dogecoin multi-year recovery trend is under pressure as price slips below a key ascending support and rests on an historic horizontal level, according to a new chart from trader and analyst Rekt Capital.
Dogecoin Is Inches Away From A Bear Market
In an X post, Rekt Capital shared a 1-month DOGE/USDT chart from Binance, created on TradingView on Nov. 15, and warned: “Dogecoin needs to protect its multi-year technical uptrend heading into December to keep chances for macro upside alive.”
The chart tracks Dogecoin from the 2021 blow-off top through the 2022–2023 bear market and the subsequent recovery. A rising trendline, built from the bear-market lows, currently runs just below the $0.18 region and has defined what Rekt Capital calls DOGE’s “multi-year technical uptrend.”
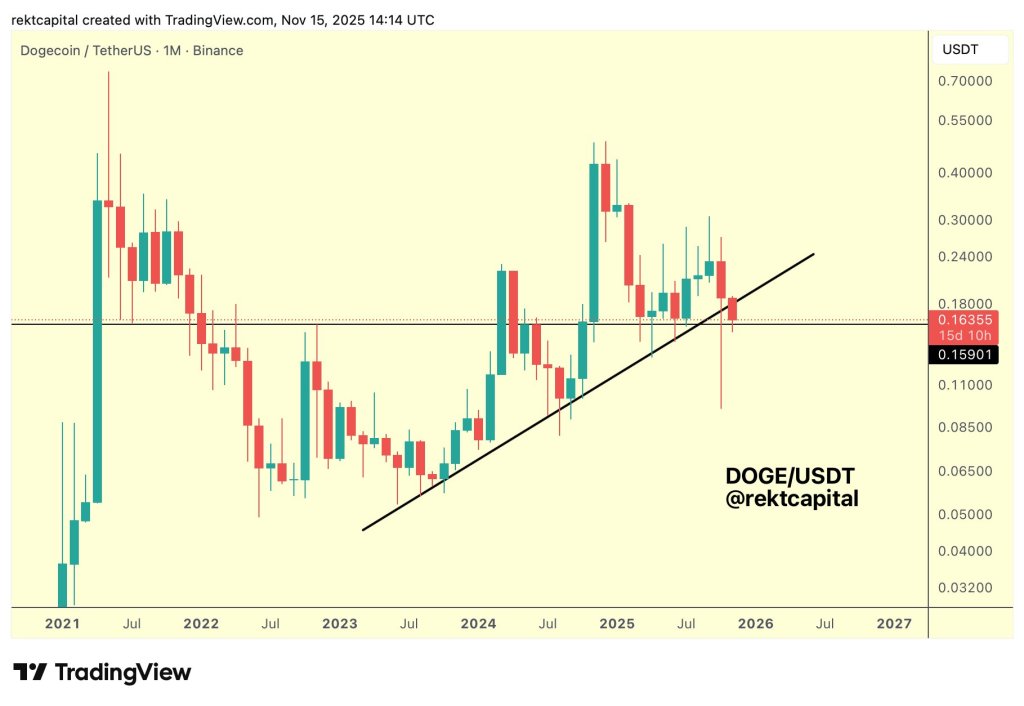
The latest monthly candle, however, shows Dogecoin trading around $0.16355, beneath that trendline and pressed against a horizontal support level near $0.159. That horizontal area is not arbitrary. On the monthly timeframe it has repeatedly flipped role between resistance and support over the last two years.
From May to October 2024, the ~$0.159–0.16 band acted as a ceiling, repeatedly rejecting upside attempts. The eventual breakout above this level in October 2024 preceded an explosive move: Dogecoin’s price nearly tripled from roughly $0.16 to a December high of $0.4843.
In 2025, the same zone then became crucial support. Between March and July, monthly candles showed downside wicks piercing below intramonth, but closes repeatedly held above the level, confirming it as a major structural floor.
What To Watch Now
That history is what makes the current retest so significant. With roughly half the month remaining, the red November candle has already lost the rising trendline near $0.18 and is now depending on the long-standing $0.159–0.16 horizontal area to arrest further downside. On a monthly chart, what matters is not just the intramonth excursion but where the candle closes.
If DOGE can reclaim and close back above the trendline, the pattern of higher lows that has defined the multi-year uptrend would remain largely intact. A monthly close decisively below the horizontal level, by contrast, would mean both the ascending support and this historically pivotal price floor have failed, materially weakening the macro bullish structure.
For now, Dogecoin sits exactly on that line in the sand. As Rekt Capital put it, DOGE “needs to protect its multi-year technical uptrend heading into December” if it is to avoid sliding back toward a bear-market profile.
At press time, DOGE traded at $0.1626.


추천 콘텐츠

White House Announces Major U.S.–China Trade Deals
Goldman Sachs crypto ETF holdings drop XRP and Solana in Q1 2026 filing