

Ethereum (ETH) Price: ETF Outflows Hit $796M in 5 Day Sell-Off. Key Levels to Watch
TLDR
- Ethereum (ETH) ETFs recorded five consecutive days of outflows totaling $795.8 million as the price dropped 10% over the week
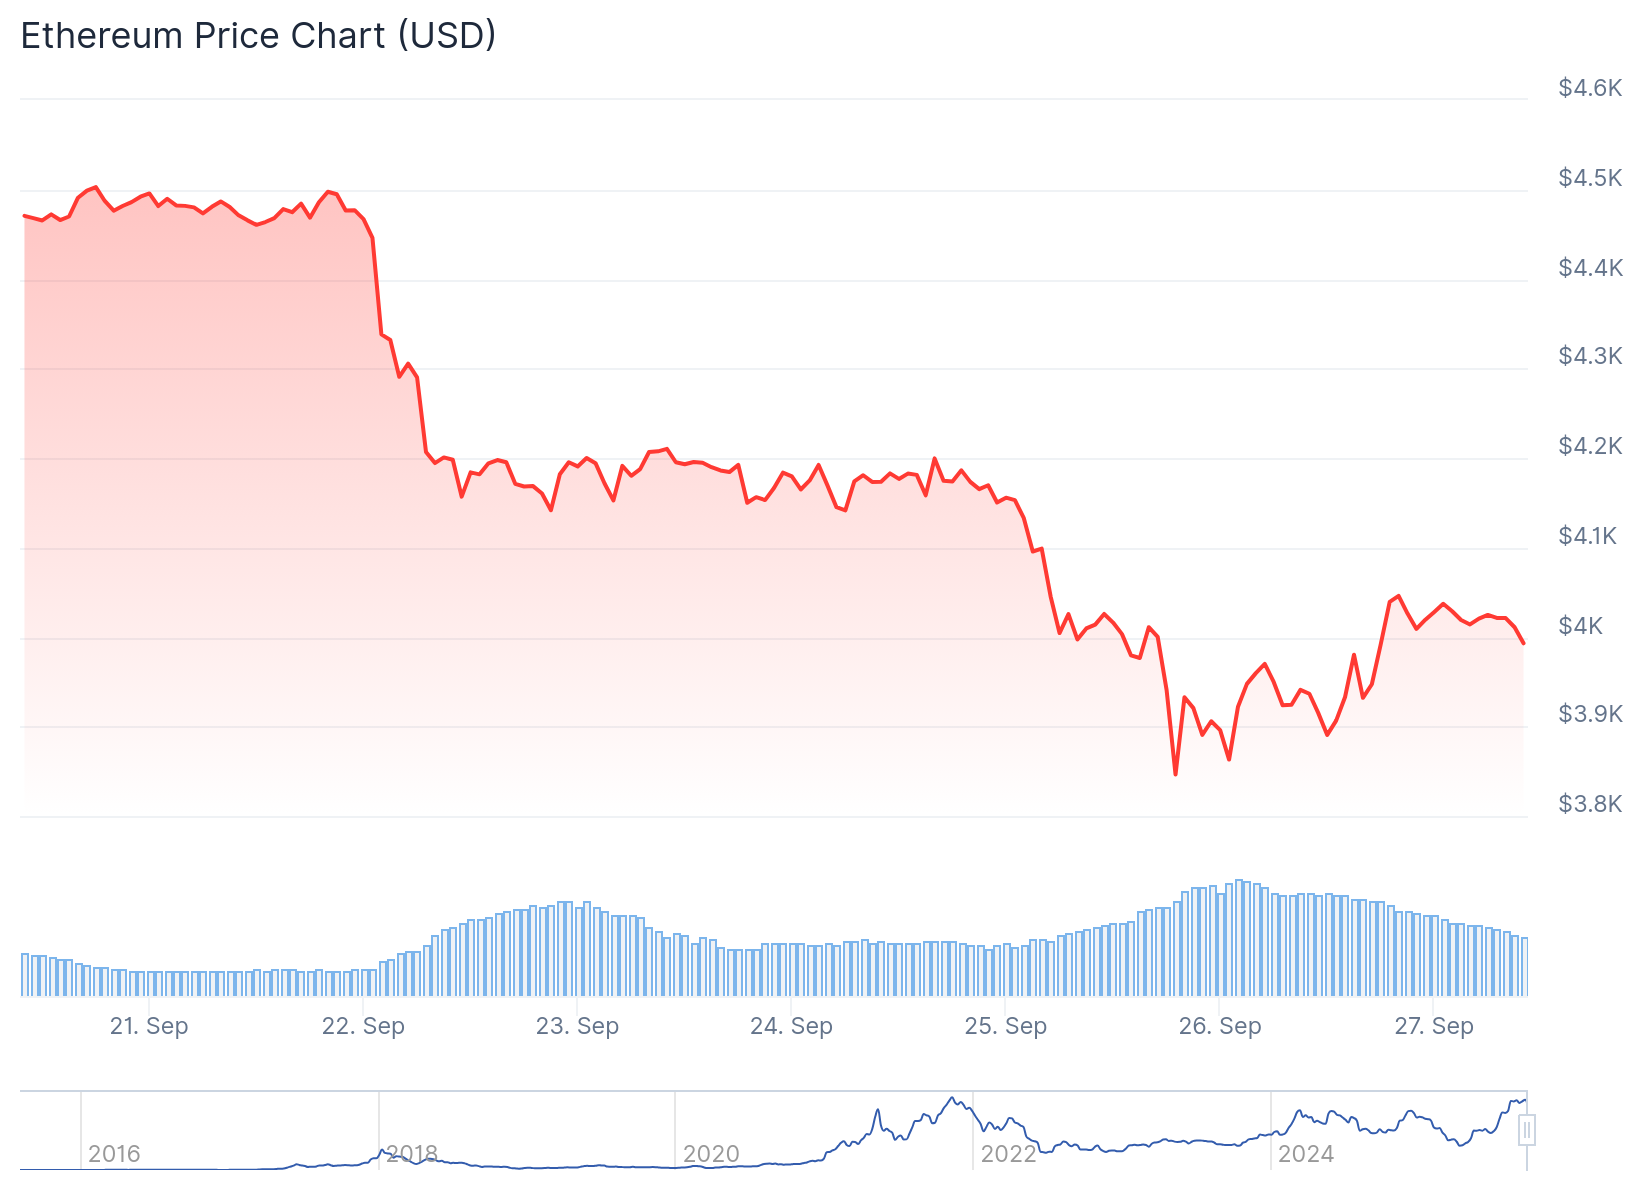
- ETH price fell to around $4,013, down 12.24% over the past 30 days, with analysts predicting further decline to $3,500-$3,600 range
- Technical analysis shows triangle pattern breakdown targeting the 20-week moving average confluence in mid-$3,000s
- Critical support level identified at $4,060, with failure potentially leading to decline toward $3,600
- Some analysts view current levels as accumulation opportunity at higher timeframe support despite continued selling pressure
Ethereum faced pressure across multiple fronts this week as exchange-traded fund outflows reached concerning levels. US-based spot Ethereum ETFs posted five consecutive days of net outflows totaling $795.8 million.
 Ethereum (ETH) Price
The selling pressure culminated on Friday with $248.4 million in daily outflows according to Farside data. This marks the first time spot Ethereum ETFs have recorded five straight outflow days since the week ending September 5.
Ethereum’s price declined 10.25% over the seven-day period, trading at $4,013 at the time of publication. The asset has fallen 12.24% over the past 30 days according to CoinMarketCap data.
The outflow streak comes as retail participation appears to be weakening for ETH. Net taker volume on Binance remained negative over the past month, indicating persistent sell-side pressure from retail traders.
Industry anticipation continues building over when the Securities and Exchange Commission will approve staking features for spot Ethereum ETFs. Grayscale prepared to stake part of its Ethereum holdings on September 19, potentially signaling confidence in regulatory approval.
Technical Analysis Points to Further Decline
Analyst Dan Gambardello identified a triangle pattern breakdown on Ethereum’s daily chart that could drive prices lower. The breakdown targets the mid-$3,000s range where the 20-week moving average converges with longer-term support.
Gambardello described the technical setup as a “throwback” he had been anticipating. The 20-week moving average is approaching the triangle trendline around $3,500-$3,600, creating what he calls “a very nice, healthy consolidation zone.”
The breakdown appears more overextended compared to other altcoins like Cardano, which remains closer to its moving average support. Ethereum’s 20-day moving average crossed below the 50-day average, showing weakening short-term momentum.
Gambardello emphasized the importance of monitoring whether ETH can break above $4,500 with strength to confirm a bullish reversal. Current market conditions include ETF dynamics, interest rate changes, and legislative developments creating additional volatility.
The analyst warned these factors lead to more fake breakouts and headline-driven price manipulation compared to previous cycles. Ethereum currently sits about halfway to the projected target, leaving room for either sideways consolidation or continued selling.
Critical Support Levels Define Recovery Path
Analyst Ted identified $4,060 as the support level that will determine Ethereum’s near-term trajectory. ETH tapped the $3,800 liquidity level as predicted before bouncing but remains trading below the key support region.
A reclaim of $4,060 would signal potential rally continuation according to Ted’s analysis. However, failure to hold this level increases chances of decline toward $3,600.
The $3,800 test validated Ted’s previous technical analysis, showing buyers remain active at lower prices. Sustained recovery requires breaking back above meaningful resistance levels.
Michaël van de Poppe views current Ethereum price levels as presenting an accumulation opportunity for longer-term investors. The analyst characterizes this zone as a “higher timeframe support test” coinciding with the approach to the 20-week moving average.
Van de Poppe’s perspective focuses on multi-week and monthly chart structures rather than daily volatility. The 20-week moving average has historically provided strong support during previous cycles.
The higher timeframe support designation suggests this pullback represents healthy consolidation rather than major trend reversal. Van de Poppe’s analysis implies current weakness creates buying opportunities for investors with longer investment horizons.
Bitcoin ETFs posted net outflows of $897.6 million over the same five-day period as Bitcoin fell 5.28% to $109,551.
The post Ethereum (ETH) Price: ETF Outflows Hit $796M in 5 Day Sell-Off. Key Levels to Watch appeared first on CoinCentral.


추천 콘텐츠

VanEck and Grayscale Advance BNB ETF Filings as SEC Review Continues

Q2 Market Insights: Bitcoin regains dominance in risk-averse environment, ETFs remain critical to market structure


