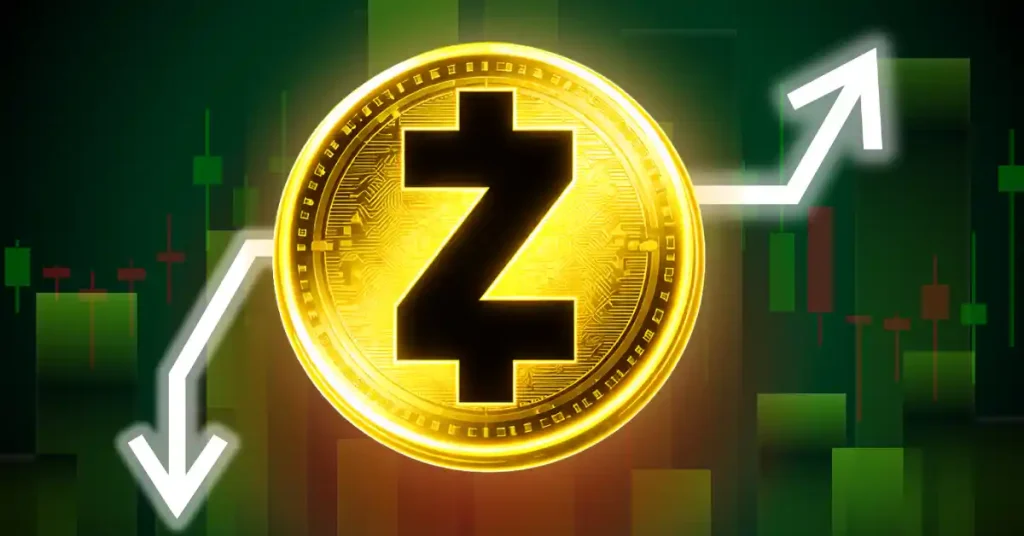
Polygon price is testing a bullish breakout after recent structural gains, with near-term targets at $0.287–$0.3255. Short-term threats include Bitcoin-driven volatility and liquidity clusters at $0.27–$0.295 that could trigger retracement before continuation.
-
Immediate outlook: Bullish structure with targets at $0.287, $0.313 and $0.3255.
-
Short-term risks: Liquidity pockets and Bitcoin weakness may cause pullbacks to ~$0.27.
-
Momentum CMF near +0.15 supports buying pressure; monitor liquidation heatmap for leveraged risk.
Polygon price rally analysis: Polygon price shows bullish momentum toward $0.29–$0.325; monitor liquidity pockets and Bitcoin strength for risk management. Read on for targets and strategy.
What is driving Polygon price’s near-term rally?
Polygon price is driven by a bullish structure break on the 1‑day chart, rising on‑chain and on‑chart momentum, and Fibonacci extension targets from the June–July advance. Short-term strength is reinforced by a positive Chaikin Money Flow (CMF) reading and concentrated buy liquidity.
How could Bitcoin weakness affect Polygon price?
Bitcoin weakness often increases cross-market volatility and can force altcoin retracements. Recent data showed large short liquidations building above $110k on Bitcoin derivatives, which can trigger sudden moves. If BTC sells off, Polygon may retrace toward the $0.27 liquidity pocket before resuming any rally.
‘,
‘
🚀 Advanced Trading Tools Await You!
Maximize your potential. Join now and start trading!
‘,
‘
📈 Professional Trading Platform
Leverage advanced tools and a wide range of coins to boost your investments. Sign up now!
‘
];
var adplace = document.getElementById(“ads-bitget”);
if (adplace) {
var sessperindex = parseInt(sessionStorage.getItem(“adsindexBitget”));
var adsindex = isNaN(sessperindex) ? Math.floor(Math.random() * adscodesBitget.length) : sessperindex;
adplace.innerHTML = adscodesBitget[adsindex];
sessperindex = adsindex === adscodesBitget.length – 1 ? 0 : adsindex + 1;
sessionStorage.setItem(“adsindexBitget”, sessperindex);
}
})();
Key Takeaways
- Bullish structure: Polygon has cleared daily resistance zones and shows medium-term targets at $0.287–$0.3255.
- Momentum confirmation: CMF near +0.15 indicates buying pressure; maintain confirmation from volume.
- Risk management: Watch liquidity pockets at $0.27 and $0.29–$0.295 and Bitcoin derivatives for spillover volatility.
Buying pressure and liquidity hints for POL
‘,
‘
🔒 Secure and Fast Transactions
Diversify your investments with a wide range of coins. Join now!
‘,
‘
💎 The Easiest Way to Invest in Crypto
Dont wait to get started. Click now and discover the advantages!
‘
];
var adplace = document.getElementById(“ads-binance”);
if (adplace) {
var sessperindex = parseInt(sessionStorage.getItem(“adsindexBinance”));
var adsindex = isNaN(sessperindex) ? Math.floor(Math.random() * adscodesBinance.length) : sessperindex;
adplace.innerHTML = adscodesBinance[adsindex];
sessperindex = adsindex === adscodesBinance.length – 1 ? 0 : adsindex + 1;
sessionStorage.setItem(“adsindexBinance”, sessperindex);
}
})();
Source: POL/USDT on TradingView (price and chart annotations used for technical levels)
On the 1‑day timeframe, Polygon posted a clear structure break in July and a follow‑through break on 31 August. Fibonacci extension levels measured from the June–July leg project near‑term targets at $0.287, $0.313 and $0.3255.
Volume and flow indicators reinforce the bullish case. The Chaikin Money Flow (CMF) has been above +0.05 for much of July and August and was approximately +0.15 at press time, indicating accumulation and buyer dominance.
‘,
‘
🔥 The Power of the TRON Ecosystem is Yours!
Click now to discover exclusive opportunities!
‘,
‘
💎 Profit Opportunities on the TRON Network
Join now to strengthen your investments!
‘
];
var adplace = document.getElementById(“ads-htx”);
if (adplace) {
var sessperindex = parseInt(sessionStorage.getItem(“adsindexHtx”));
var adsindex = isNaN(sessperindex) ? Math.floor(Math.random() * adscodesHtx.length) : sessperindex;
adplace.innerHTML = adscodesHtx[adsindex];
sessperindex = adsindex === adscodesHtx.length – 1 ? 0 : adsindex + 1;
sessionStorage.setItem(“adsindexHtx”, sessperindex);
}
})();
Combined, the structural break, positive CMF and extension targets point to a credible medium‑term upside if buying remains steady.
Liquidity map warns of hurdles
Source: CoinGlass liquidation heatmap (liquidations and clustered orders displayed as reference)
The liquidation heatmap highlights concentrated liquidity zones both above and below the current price, suggesting potential stops for leveraged traders. The immediate south pocket around $0.27 could act as a magnet during a short‑term pullback.
Northward, magnetic zones at $0.29 and $0.295 contain clustered orders that often trigger temporary pauses or reversals. Bulls need consistent volume and follow‑through to clear these levels decisively.
Traders should factor in cross‑market drivers. Derivatives positioning on Bitcoin and on‑chain flows historically precipitate sharp altcoin moves; monitoring those metrics is critical for risk control.
Frequently Asked Questions
What are the most likely short-term scenarios for Polygon price?
Polygon is likely to either push toward the $0.287–$0.3255 targets on sustained buying or retrace to the $0.27 liquidity pocket if Bitcoin weakens or if clustered sell liquidity near $0.29 triggers a pause.
How should traders manage risk around current levels?
Use tight risk controls: set stops below key liquidity pockets, scale position size relative to volatility, and watch CMF, volume and Bitcoin derivatives for early signs of cross‑market stress.
Where does this analysis source its data?
Chart and level analysis are based on POL/USDT chart data (TradingView), liquidation heatmap readings (CoinGlass), and on‑chain indicators. These sources are cited as plain text for reference.
Conclusion
Polygon price currently displays a bullish daily structure with clear Fibonacci targets and supportive momentum, but it remains sensitive to Bitcoin‑led volatility and clustered liquidity zones at $0.27–$0.295. Traders should combine on‑chart confirmations with liquidation heatmap checks and prudent risk management. For ongoing coverage and updates, follow COINOTAG’s Polygon market analysis and data summaries.
Disclaimer: The information presented does not constitute financial, investment, trading, or other advice and represents the author’s analysis and opinion only. Publication date: 2025-09-02. Author/Organization: COINOTAG.
Source: https://en.coinotag.com/polygon-pol-could-climb-past-0-29-as-bitcoin-volatility-may-curb-rally/