

Litecoin Price Prediction: Is LTC Breaking Out After 1,249-Day Base? Expert Says It’s the ‘Next XRP’
TLDR:
- Litecoin has consolidated below the $130 resistance level for 1,249 days, showing long-term accumulation.
- Analysts project a breakout rally toward $272 if Litecoin secures a strong close above the $130 resistance.
- Monthly candles since 2022 show higher lows, suggesting accumulation and constructive price action in LTC.
- Litecoin trades at $108, with daily and weekly declines signaling caution despite long-term bullish potential.
Litecoin has been consolidating below a key resistance zone for more than three years. A new analysis by trader Alex Clay highlights a 1,249-day accumulation period that could soon end. The chart suggests a breakout above $130 may trigger a rally toward $272. Meanwhile, Litecoin trades at $108 following weekly and daily declines.
Long-Term Litecoin Price Accumulation and Resistance
Litecoin has spent over 1,249 days trading between $50 and $130. Such extended consolidation often indicates suppressed volatility before expansion. Besides, repeated retests of this range have reinforced the $115–$130 resistance zone.
Historically, Litecoin has failed to secure a convincing monthly close above $130. The last attempts occurred in 2018, 2021, and 2022. Current price action shows the cryptocurrency consolidating below this threshold.
Clay’s chart illustrates $272 as the next resistance level if a breakout occurs. This level has historically acted as a rejection zone in previous cycles. Hence, surpassing $130 with strong volume could accelerate the move toward this target.
LTC Market Structure and Outlook
Monthly candles since mid-2022 have formed higher lows. This pattern often suggests accumulation before upward expansion. Additionally, the prolonged sideways structure supports the case for a potential breakout.
However, short-term market performance remains weak. Litecoin trades at $108, down 2.72% in 24 hours and 6.60% over the week, per CoinGecko. Consequently, traders may remain cautious until confirmation of a resistance break.
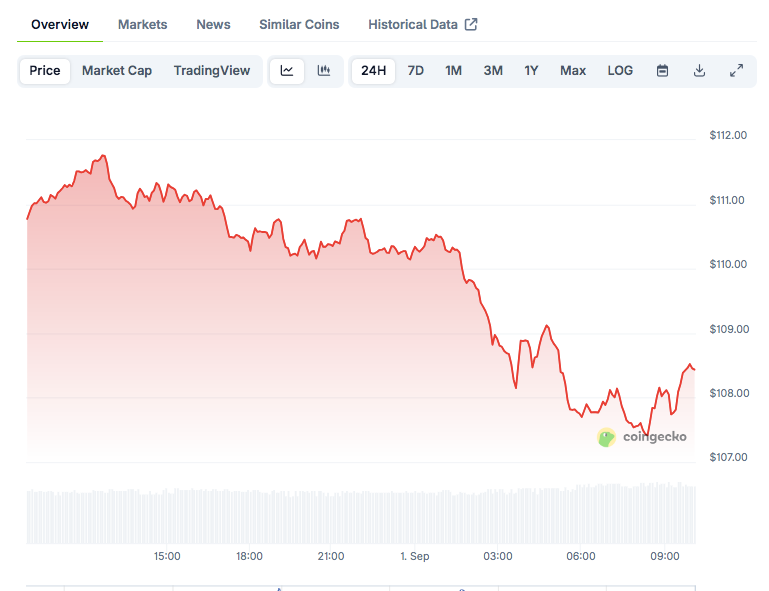 LTC price on CoinGecko
Clay compared Litecoin’s setup to XRP’s breakout after long consolidation. Moreover, he suggested that LTC could mirror such momentum once resistance clears. Still, bearish pressure from declining prices highlights the need for volume-backed confirmation.
The post Litecoin Price Prediction: Is LTC Breaking Out After 1,249-Day Base? Expert Says It’s the ‘Next XRP’ appeared first on Blockonomi.


추천 콘텐츠

Dogecoin Price Prediction Points to Historic Rally: Here’s What Comes Next for DOGE

JPMorgan Expands Bitcoin ETF Bet Despite BTC Decline


