

Cardano (ADA) Price: Golden Cross Signals Hope for Bulls as Critical Support Holds
TLDR
- Cardano (ADA) currently trading at $0.876 with $1.28 billion daily volume
- Golden cross formation on daily chart signals potential bullish momentum
- Critical support zone between $0.85-$0.87 needs to hold for upward movement
- Over $90 million in shorts at risk above $0.97, setting up possible short squeeze
- Openbank (under Santander) integration provides fundamental strength with 2 million customer access
Cardano (ADA) is at a critical juncture as it trades at $0.876, showing mixed signals that have traders divided on its next move. Recent price action reveals a 7% decline over two days, with sellers maintaining control despite the substantial daily trading volume of $1.28 billion.
On-chain data from Santiment shows the Network Realized Profit/Loss metric has reached its highest level since July. This indicates many investors are taking profits, which has limited ADA’s recovery attempts.
The $0.85-$0.87 range has emerged as a crucial battleground. This support zone has held through multiple tests, maintaining ADA’s higher low formation despite bearish pressure.
From a technical perspective, Cardano is struggling beneath the 50-EMA at $0.8819. A rejection near $0.923 formed a bearish engulfing candle, while the Relative Strength Index sits at 44, suggesting sellers still have room to push lower.
If ADA loses the $0.8528 support level, the next downside targets are $0.8264 and $0.8033. However, reclaiming $0.8843 would be the first sign of strength, potentially opening the way to $0.9018 and $0.9234.
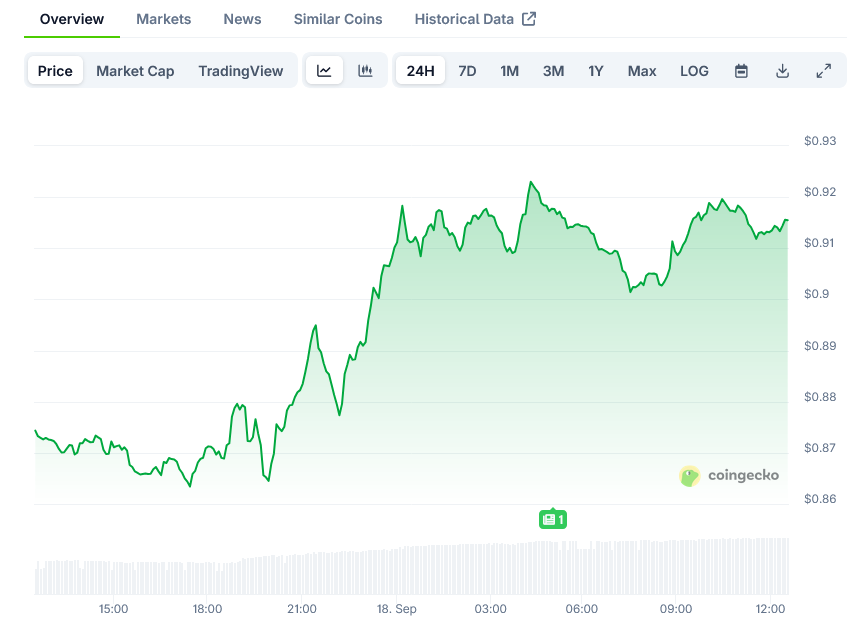 Cardano Price on CoinGecko
Technical Patterns Signal Potential Breakthrough
A major technical development has been Cardano’s reclamation of its descending trendline. This breakout came after several failed attempts, making this move particularly noteworthy as it places ADA in a more favorable position.
Perhaps even more important is the confirmation of a golden cross on the daily chart. This classic bullish indicator occurs when the 50-day moving average crosses above the 200-day moving average, often signaling a shift from a downtrend into a potential recovery phase.
These technical shifts have some analysts targeting the 0.786 retracement level near $1.75 as a potential longer-term target, though shorter-term resistance at $1 remains the immediate challenge.
Current market positioning shows over $90 million in shorts vulnerable if the price extends toward $0.97. This cluster of liquidation points suggests any sharp breakout could accelerate rapidly as short sellers are forced to cover their positions.
Despite the technical promise, trader sentiment remains mixed. Only a handful appear bullish on Cardano, which some interpret as a contrarian indicator potentially supporting further upside.
Fundamental Developments Support Long-Term Outlook
Beyond price action, Cardano’s fundamentals continue to strengthen. Openbank, Europe’s largest digital bank under Santander, recently integrated Cardano for 2 million customers. This development boosts the institutional adoption narrative, providing a potential longer-term bullish catalyst.
However, caution persists in the near term. On-chain data shows a $6.7 million net outflow from exchanges on September 17, reflecting investor hesitation. Unless inflows pick up, ADA may continue trading sideways or drift lower before staging its next rally.
For now, the $0.87-$0.85 zone remains Cardano’s key battleground. A decisive break above $0.90 could reignite bullish momentum and put ADA back on track toward the psychological $1 level. Conversely, a breakdown below $0.85 risks exposing deeper support zones at $0.82 and $0.78.
Trading strategies differ based on risk tolerance. Aggressive bears may consider short positions below $0.8528, while conservative bulls might wait for confirmation of a breakout above $0.90 before entering long positions.
The ability to hold key support between $0.85 and $0.87 will likely determine whether the bullish scenario plays out successfully. If this zone holds, it sets the stage for a push toward $1 and potentially beyond.
ADA’s daily chart continues to trend upward despite recent weakness. The technical structure suggests there’s room for optimism as long as the higher low formation remains intact. This consolidation pattern often signals accumulation phases that precede stronger moves.
With multiple technical signals stacking up in favor of the bulls, Cardano appears positioned for potential upside if buyers can maintain control above critical support levels. The most recent price data shows ADA at $0.876 as traders await the next decisive move.
The post Cardano (ADA) Price: Golden Cross Signals Hope for Bulls as Critical Support Holds appeared first on Blockonomi.


추천 콘텐츠

Crypto Market News Today—Bitcoin Slashes While Ethereum & XRP Display Strength

Chainlink Whale Activity Rises While Price Bleeds for 7 Straight Months


