Dogecoin Fisher Transform Turns Bullish: The Last Setups Were Explosive
Dogecoin’s monthly Fisher Transform has crossed bullish again, according to trader Cantonese Cat, reviving a macro signal that has previously appeared near major DOGE basing periods rather than at clean, immediate breakouts.
The chart, posted May 14 via X, shows DOGE near $0.1146 after a multi-month decline from its 2024 high, with the Fisher line turning up from deeply negative territory. The Fisher Transform is a technical indicator designed to convert price action into a more normalized distribution, helping traders identify potential reversals or major shifts in price behavior. In charting practice, a bullish flip typically refers to the Fisher line crossing above its signal line after an oversold trough. On a monthly chart, that makes it a slow regime signal, not a short-term trigger.
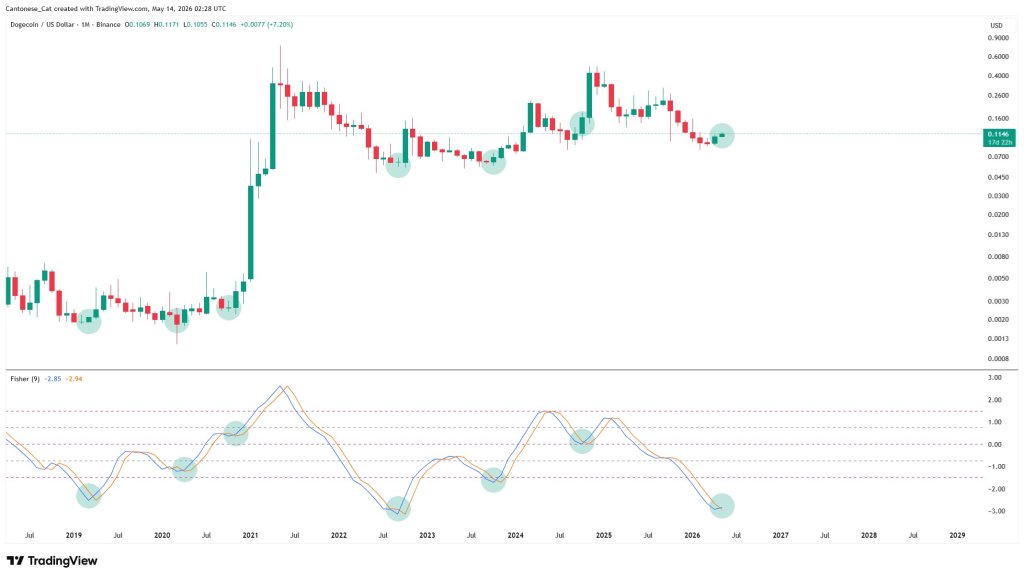
Cantonese Cat framed the move cautiously. When another user asked, “2 more years to see god candle? Looks like nothing happens when Fisher is under 0,” the trader replied: “It’s true, it may consolidate for longer, but it depends on how impulsive liquidity goes. I’m OK with it being slow as long as it bottomed.”
That distinction matters. The chart is less a call for an immediate vertical move than a claim that DOGE may have shifted from capitulation into base-building.
History Says Watch Dogecoin
Historical cases support that more careful reading. The first comparable macro reversal on the chart came after Dogecoin’s 2019 trough. DOGE closed around $0.0018 in early February, 2019, while it ended the year at $0.00437. That implies a roughly 143% rebound from the low, but it was not the blow-off phase many traders associate with DOGE. It was a recovery from a depressed base.
The 2020 setup was more consequential. DOGE traded as low as $0.00125 in mid-March 2020, during the market-wide COVID liquidation. Dogecoin later recorded its all-time high at $0.7316 on May 8, 2021. Measured from the March 2020 low to that peak, the rally was about 58,400% and took roughly 14 months. The timing lesson is that the bottom came long before the speculative mania reached its endpoint.
The 2022 cycle also underscores the delay. DOGE price bottomed at $0.04908 on June 18, 2022, while the next high came in December 2024 at $0.4825. That implies an advance of roughly 883% from the bear-market low to the 2024 cycle high, across about two and a half years. There were rallies inside that period, including the late-2022 rebound, but the larger recovery was a drawn-out structure rather than a single monthly candle.
The current setup looks closer to those basing phases than to a confirmed breakout. DOGE’s 2026 yearly low is near $0.0813. Against the chart’s roughly $0.114–$0.115 level, DOGE has moved off the low but remains far below the prior cycle’s range high.
That is why the Fisher flip is best read as a momentum reset, not a price target. For bulls, the signal suggests monthly downside momentum may be losing force after a deep oscillator trough. For skeptics, the caveat is equally clear: past flips did not prevent extended consolidation, and DOGE’s largest rallies required enough liquidity and risk appetite to turn a technical base into sustained demand.
At press time, DOGE traded at $0.1137.


추천 콘텐츠

How Will XRP Price React After the FOMC Meeting Today?
![[Rappler’s Best] Can Chiz Escudero retake the Senate presidency? Manic Monday scenarios](https://www.rappler.com/www.rappler.com/tachyon/2026/05/ronald-bato-dela-rosa-senate-plenary-may-13-2026-001-scaled.jpg?resize=2560%2C1707&zoom=1)
[Rappler’s Best] Can Chiz Escudero retake the Senate presidency? Manic Monday scenarios