

Ethereum (ETH) Price: Big Money Is Buying the Dip — Here’s What ETH Needs to Breakout
TLDR
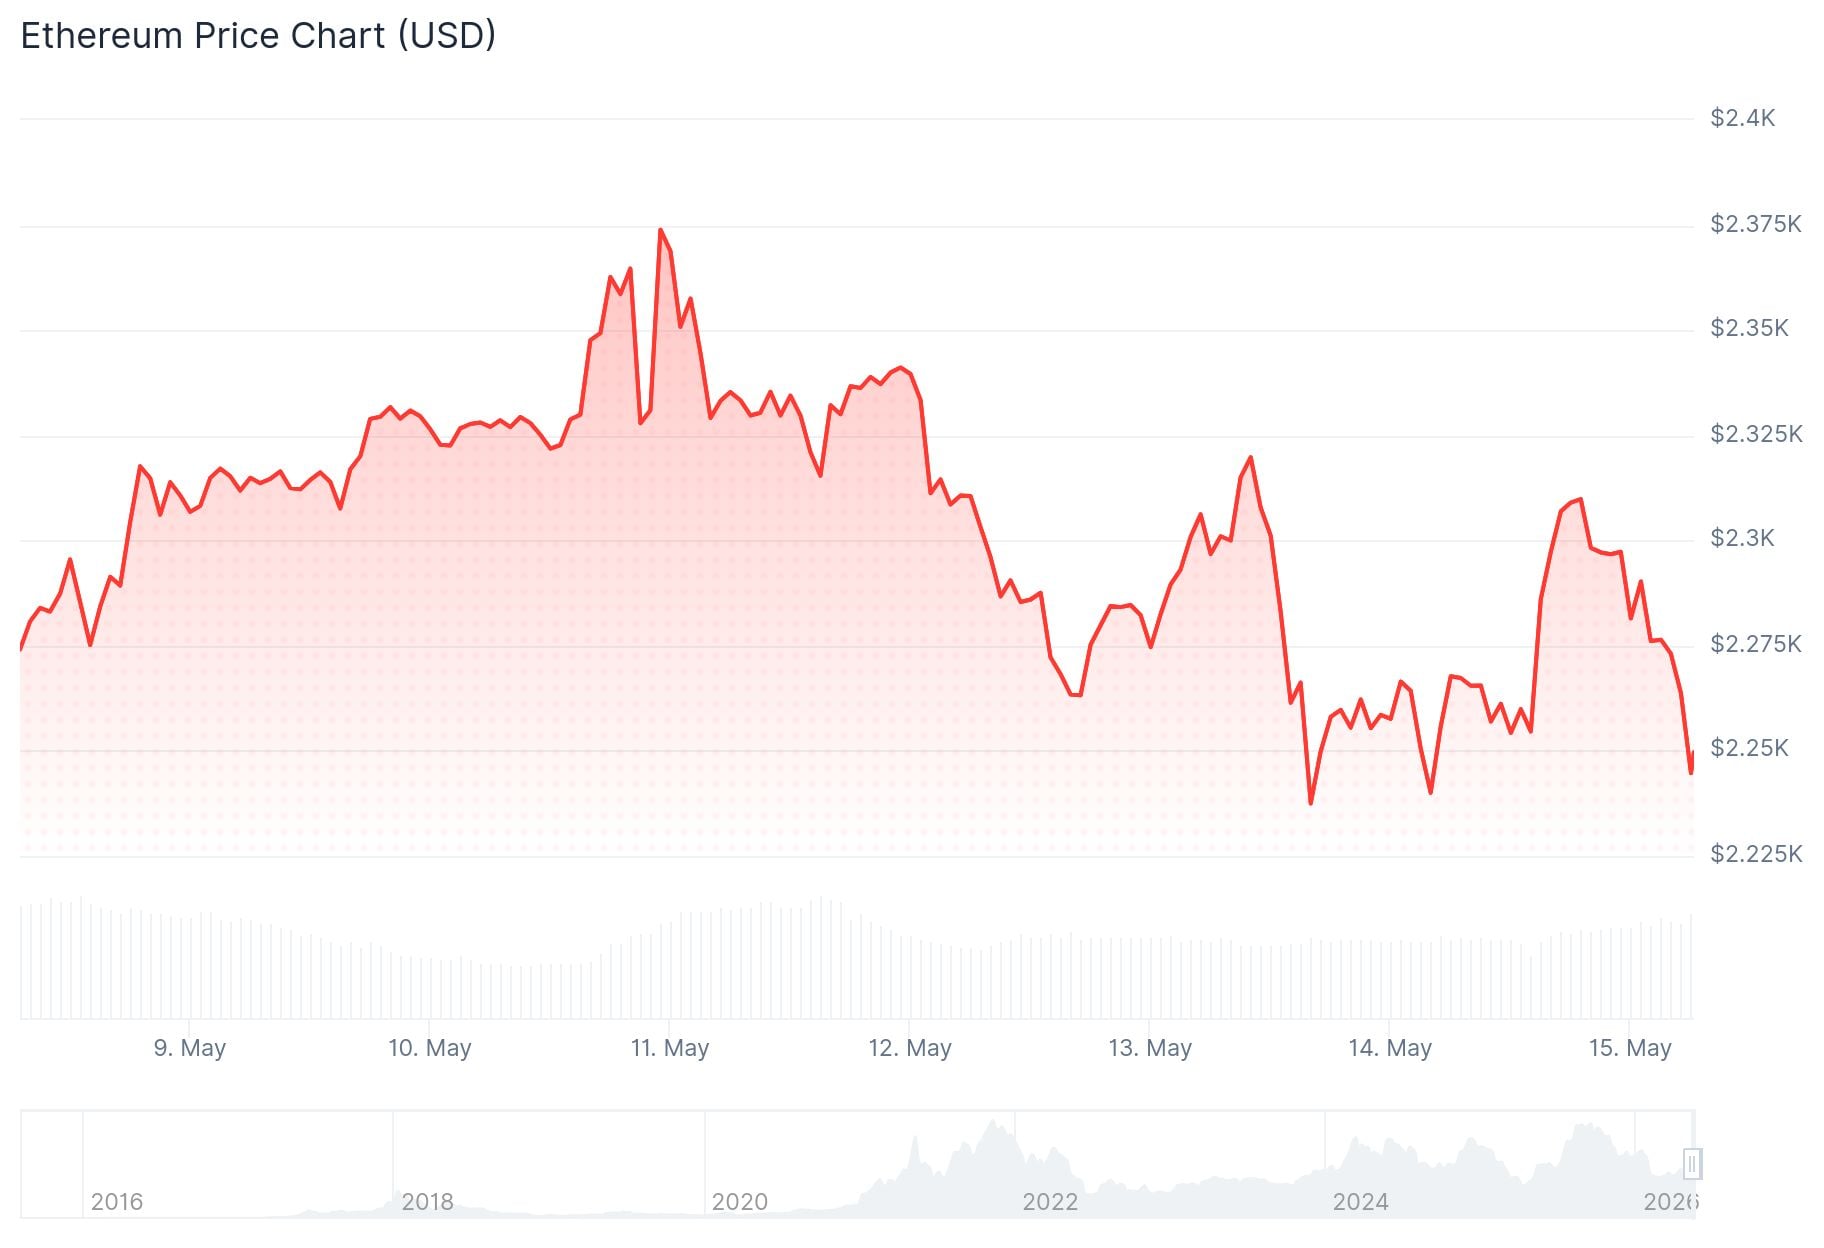
- ETH is trading at $2,316.20, up 2.08% in the last 24 hours
- Jane Street increased its Ethereum ETF position by nearly $82 million in Q1 2026
- Whale sell walls near $2,320 and $2,400 are blocking a stronger recovery
- ETH must break above $2,323 for the first real recovery signal, analysts say
- Key support sits at $2,247, the 50-day moving average
Ethereum is holding above $2,300 as a mix of growing institutional interest and whale resistance shapes its short-term price action.
 Ethereum (ETH) Price
At the time of writing, ETH is trading at $2,316.20, up 2.08% over the past 24 hours. Daily trading volume stands at $24.12 billion, with a market cap of $277.94 billion.
Analyst Ted Pillows noted on X that ETH retested the $2,250 support zone recently. He said if that level holds, Ethereum could bounce toward $2,350–$2,400, but losing it could push ETH toward $2,150 or lower. This lines up closely with the technical picture on the charts.
On the institutional side, large investment bank Jane Street increased its Ethereum ETF exposure by nearly $82 million in Q1 2026. At the same time, the firm reduced its positions in Bitcoin and MicroStrategy.
Whale Sell Walls Blocking the Path Up
Crypto analyst CW flagged that Binance whales have placed a large sell wall near $2,400. A smaller barrier from Coinbase whales sits near $2,320. These stacked resistance zones are limiting ETH’s recovery attempts.
ETH bounced from a recent low near $2,233 but has struggled to hold higher ground. The $2,320 level is the first test buyers need to clear.
On May 14, analytics firm Alphractal pointed out that Ethereum’s “Realized Cap Impulse” remained positive despite a 3% price drop. This suggests fresh capital is still entering the network, even during weaker price periods.
What the Technical Indicators Show
The RSI currently sits at 49.94, just below the neutral 50 mark. The 50-day moving average holds at 52.88. The MACD line is at 8.29, below the signal line of 17.92, with a negative histogram of -9.63, pointing to fading short-term momentum.
Analyst More Crypto Online says ETH’s wave structure suggests a corrective pattern may still be playing out. The $2,220–$2,230 area is the key support zone buyers need to defend.
If ETH fails to break $2,323, the chart suggests price could revisit lower trend support. If it clears the level, $2,380 becomes the next resistance target.
The most recent data shows ETH holding the $2,316 area, with institutional inflows continuing and key technical levels closely watched by traders.
The post Ethereum (ETH) Price: Big Money Is Buying the Dip — Here’s What ETH Needs to Breakout appeared first on CoinCentral.


추천 콘텐츠

Litecoin (LTC) Price Prediction: Multi-Year Base Formation Revives Bullish Breakout Outlook Above $60

Iran’s army chief warns of ‘total destruction’ for ground invasion


