

Shiba Inu today: Daily neutral, intraday bearish – watch 1H EMA cluster
Markets remain defensive as capital waits for leadership. In this context, Shiba Inu today sits between a neutral daily backdrop and a bearish intraday lean, keeping price reactive while liquidity clusters around Bitcoin.
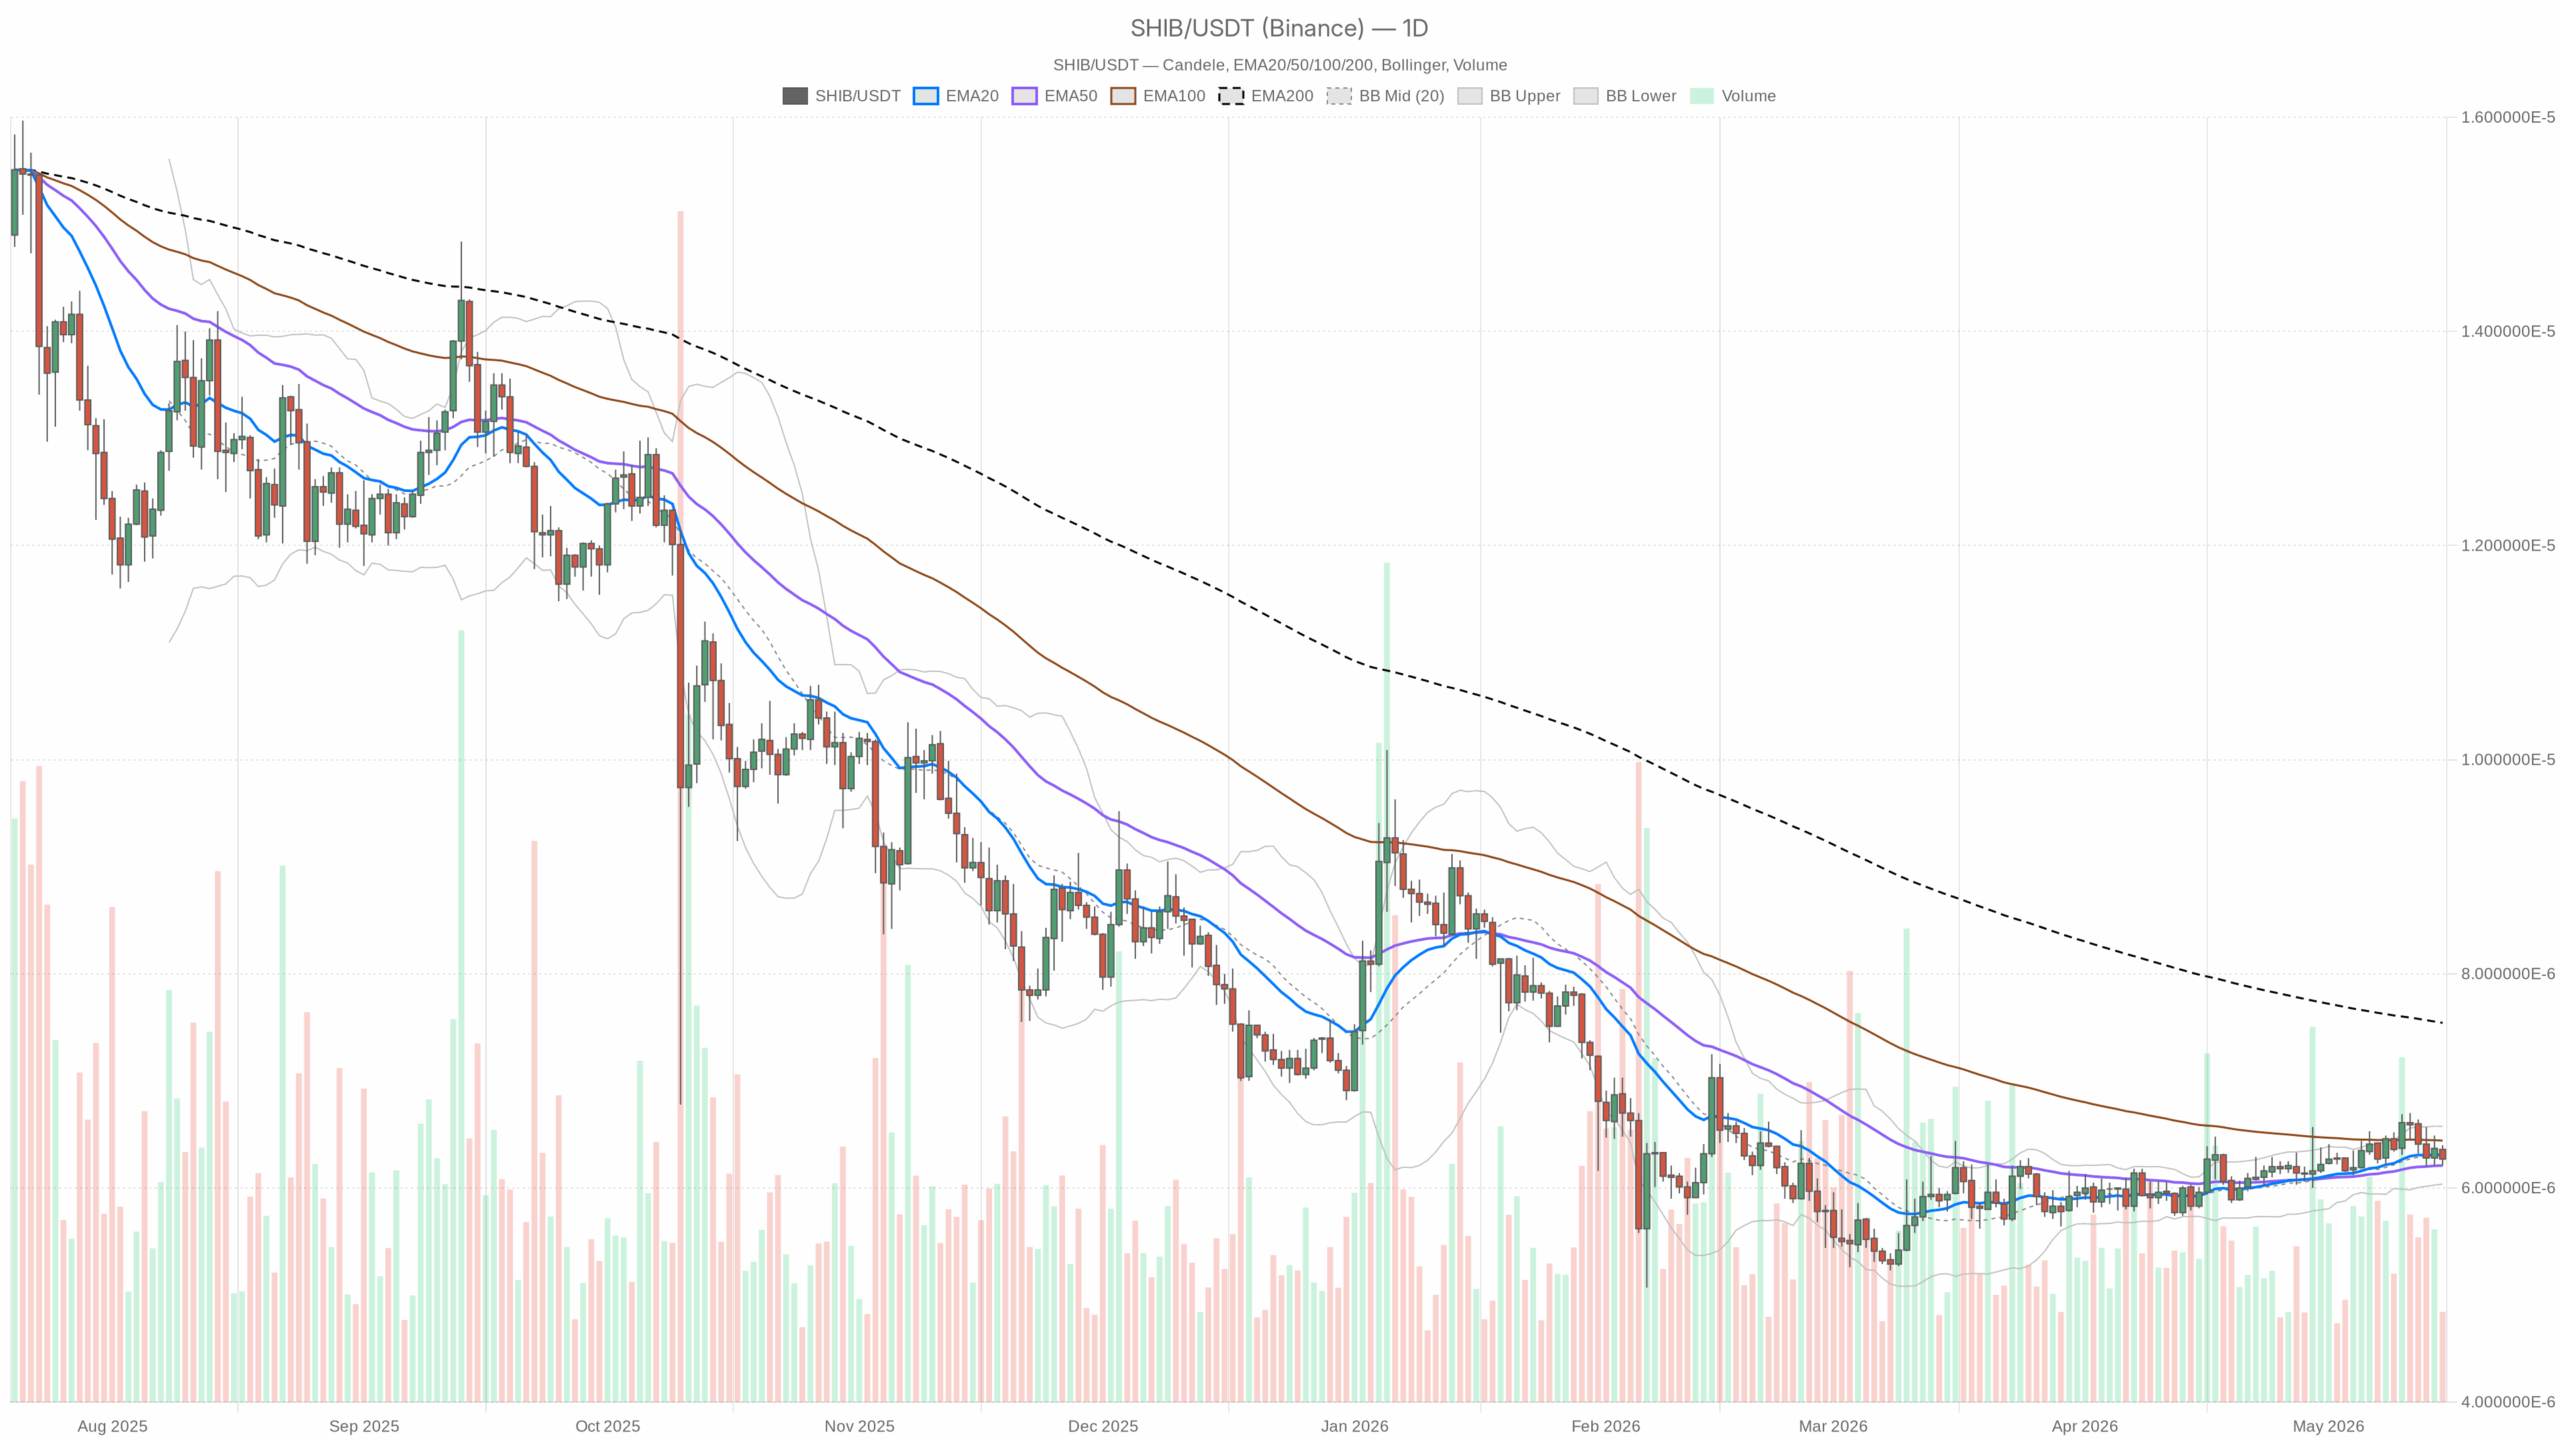 SHIB/USDT — daily chart with candlesticks, EMA20/EMA50 and volume.
Market context and bias
As of 15 May 2026, Bitcoin dominance stands near 58% and the crypto fear/greed index reads 43 (Fear). Meanwhile, leadership is top-heavy and alt risk is selective, which keeps SHIB reactive rather than proactive.
Total crypto market cap is up about 1.1% over 24 hours alongside a jump in turnover. However, that bid still skews to BTC, so any upside in SHIB needs confirmation, not hope.
Structure first, signals second
For now, Daily (macro bias) is neutral. There is no clear trend advantage, so mean reversion still has a say. Momentum must prove itself before any chasing.
Meanwhile, 1H (tactical) is bearish. Sellers control the tape intraday, but it is not a waterfall. Expect lower highs and hesitant dips rather than panic.
Additionally, 15m (execution) has a bearish tilt. This is the frame to stalk entries; it favors sell-the-bounce until the intraday structure flips.
Indicator evidence (used as context, not crutches)
Overall, RSI (14) on the daily reads 50.02. That is dead-center equilibrium; the trend is undecided and range dynamics dominate.
Meanwhile, RSI (14) on 1H prints 42.99. Downside momentum is mild; sellers control the tape intraday but have not stretched it to extremes.
Similarly, RSI (14) on 15m sits at 43.99. The execution frame still leans to fading rips rather than bottom-fishing.
However, MACD is flat across frames, offering no momentum edge today. When MACD does not bite, prioritize price structure and RSI shifts around 50.
Therefore, treat the 1H 20/50 EMA zone as the battleground. Bulls need a reclaim and hold above that cluster to flip the intraday bias; below it, rallies are suspect.
For now, Bollinger Bands show range-like behavior and are waiting on expansion. A band expansion with RSI crossing 50 on 1H would be the cleanest momentum tell.
Accordingly, ATR offers no actionable read. Operate as if volatility is compressed and be ready for directional expansion — risk cuts both ways from here.
Alternatively, use the prior session high/low as practical pivots for intraday planning. Reclaiming the prior day’s high would argue for initiative buyers; losing the prior day’s low keeps pressure on.
How the timeframes fit together
That said, daily neutrality keeps the door open both ways, while the 1H and 15m bearish lean makes bounces guilty until proven innocent. Often, a fake move comes first — a pop into resistance that fails, or a final sweep of lows that springs back. Trade location matters more than conviction.
Bullish scenario
Moreover, bulls need an intraday higher low and a sustained 1H close back above the 20/50 EMA cluster. Ideally, RSI reclaims and holds above 50. That flips the tape from sell-the-rip to buy-the-dip and opens a push toward recent range highs. Invalidation: a clean break back below the reclaimed EMA cluster and loss of the prior 1H swing low.
Bearish scenario
Conversely, if the 1H keeps printing lower highs and RSI cannot retake 50 on bounces, expect another probe of the range lows. A weak daily close with RSI slipping toward the mid-40s would confirm momentum is wearing down the floor. Invalidation: a strong 1H close above the EMA cluster with follow-through, not an immediate rejection.
Positioning and risk
Accordingly, with Shiba Inu today showing a neutral daily and bearish intraday mix, keep position sizes modest and respect intraday levels. Favor reactive tactics: fade into resistance while the 1H stays below its EMA cluster, or switch long only after a clear reclaim with RSI strength. Volatility can expand quickly out of ranges, so predefine exits on both sides.
To sum up, the daily is neutral, the intraday is bearish, and the next clear trigger should set direction; until then, prioritize structure over conviction.


추천 콘텐츠

Spot XRP ETFs Top $60M in Weekly Flows, Best Week Since December

Russian Stablecoin A7A5 Claims It Can Thrive Even If Sanctions Are Lifted


