

Toncoin price at key $2 support, can an impending golden cross trigger a rebound?
Toncoin price continued consolidating near a critical support region this week after a sharp post-breakout correction, while technical indicators suggested a potential longer-term trend reversal could still be developing.
- Toncoin price continued consolidating near the key $2 support zone after retreating from its recent rally toward the $2.90 region.
- TON formed a potential bullish flag pattern on the daily chart while the 50-day and 200-day moving averages approached a possible golden cross.
- A breakout above the descending channel near $2.30 could open the door toward $2.90–$3, while losing $2 support may expose TON to a pullback toward $1.80.
According to data from crypto.news, Toncoin (TON) price traded around $2.01 at press time on May 15 after briefly falling below the key psychological $2 support level earlier in the session. Despite the recent pullback, the token remains significantly above its April lows near the $1.20 region.
Toncoin’s earlier rally was fueled by renewed optimism surrounding the TON ecosystem and improving sentiment across Telegram-linked crypto applications. Traders also continued monitoring speculation surrounding deeper blockchain integrations within Telegram’s broader ecosystem, which helped drive strong buying momentum earlier this month.
However, the latest correction suggests that short-term bullish momentum has cooled after TON surged nearly 100% in just a few sessions. The token faced heavy resistance near the $2.80–$2.90 region, triggering profit-taking activity and a gradual decline over the past several days.
At the same time, participation across the TON ecosystem remains below peak levels seen during last year’s rally cycle. Decentralized finance activity and transaction growth have stabilized but have yet to fully recover, while several TON-linked gaming and tap-to-earn projects continue trading far below their previous highs.
Toncoin price analysis
On the daily chart, Toncoin appears to be consolidating inside a downward-sloping channel following its explosive breakout rally earlier this month. The structure resembles a potential bullish flag pattern, which typically forms after a strong impulsive move higher and often signals temporary consolidation before trend continuation.
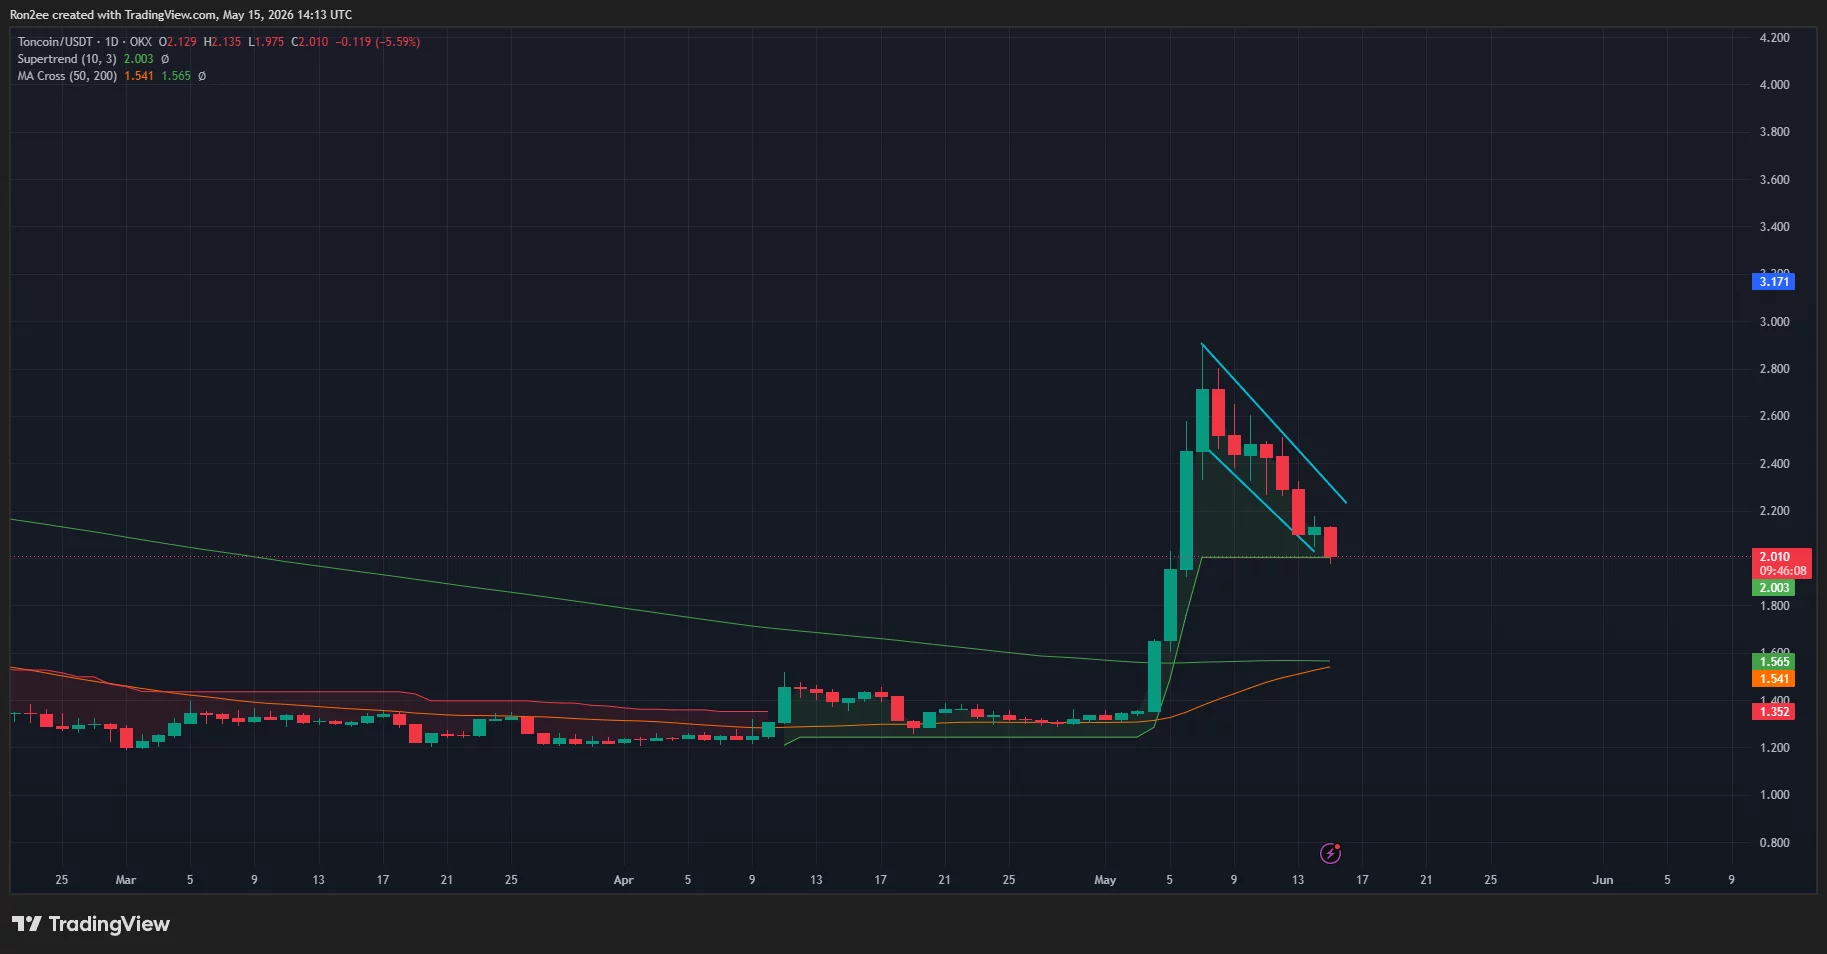
TON continues defending the important $2 support zone, which also aligns closely with the daily Supertrend support visible on the chart. Holding above this level could help preserve the broader bullish structure despite the ongoing cooldown phase.
One of the more important technical developments is the approaching golden cross formation between the 50-day and 200-day moving averages. A golden cross occurs when the shorter-term moving average crosses above the longer-term moving average and is generally viewed as a bullish long-term trend reversal signal.
The 50-day moving average has now started curving sharply higher toward the 200-day moving average following TON’s recent breakout rally, suggesting bullish momentum may gradually be strengthening despite the current consolidation.
Momentum indicators, however, continue showing mixed signals in the short term. The MACD histogram has weakened noticeably over the past several sessions, while the MACD lines are attempting to stabilize after approaching a bearish crossover earlier this week.
If bulls successfully reclaim the upper boundary of the descending channel near the $2.25–$2.30 region, Toncoin could attempt another move toward the recent swing high near $2.90. A confirmed breakout above that resistance zone may then open the door toward the psychological $3 level.
On the downside, failure to hold above the key $2 support region could weaken the bullish continuation structure and potentially expose TON to a deeper retracement toward the $1.80 area, where buyers previously stepped in during the initial breakout phase.
Disclosure: This article does not represent investment advice. The content and materials featured on this page are for educational purposes only.


추천 콘텐츠

Bitcoin ETF Outflows, CLARITY Act, Treasury Yields: What Crypto Investors Should Watch This Week

Iran Plans New Strait of Hormuz Transit System With Vessel Fees


