BTC Spot CVD Chart Analysis: Key Support and Resistance Levels from May 15 Data
BitcoinWorld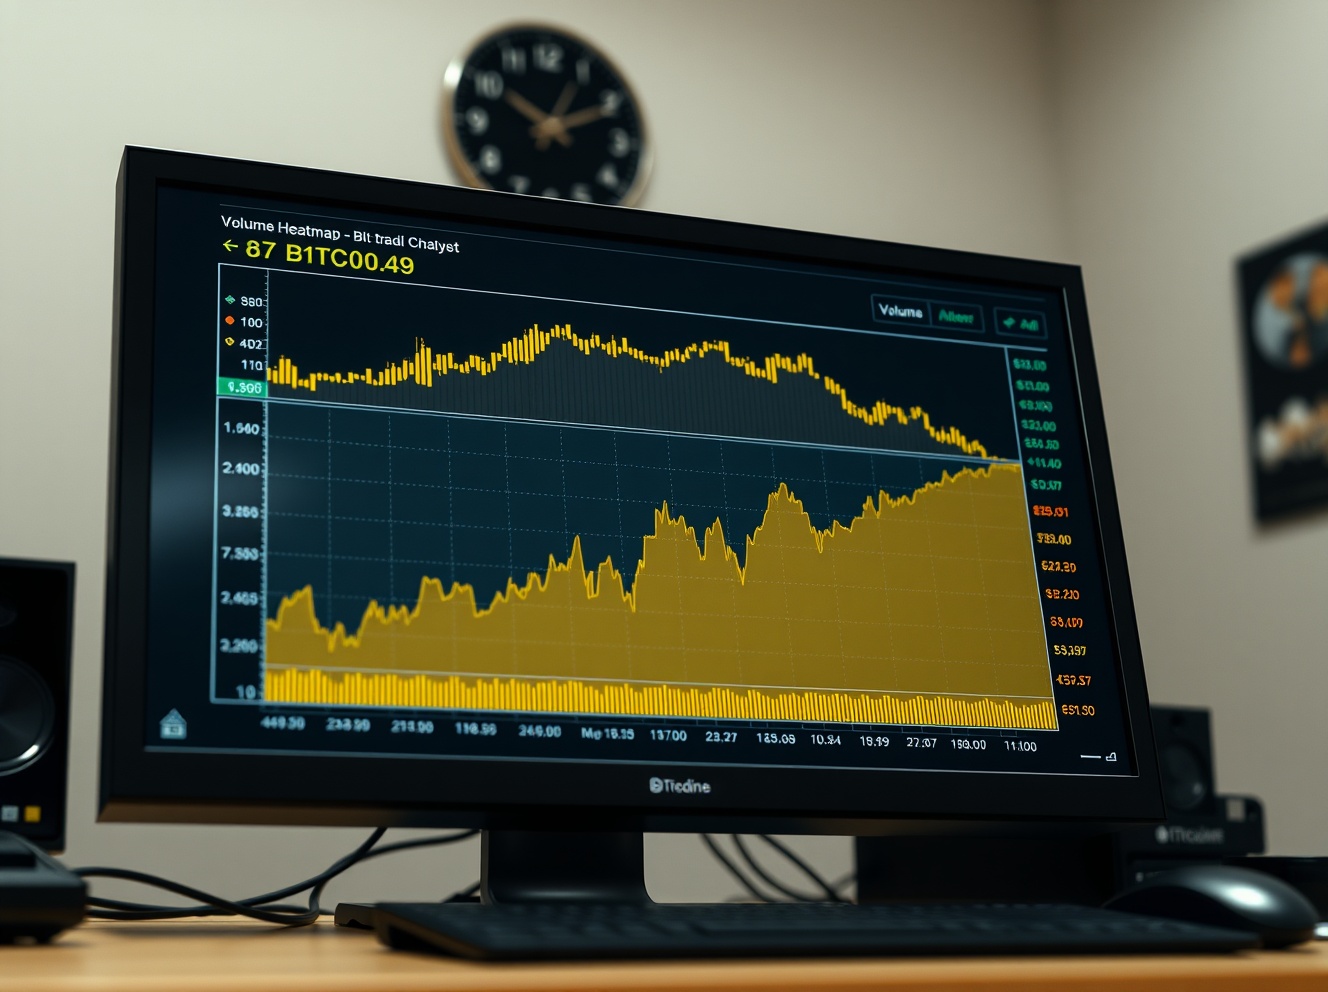
BTC Spot CVD Chart Analysis: Key Support and Resistance Levels from May 15 Data
On May 15 at 5:00 p.m. UTC, the BTC spot Cumulative Volume Delta (CVD) chart for the BTC/USDT trading pair revealed notable patterns in order book activity. The chart, which combines a Volume Heatmap with CVD indicators, offers traders a detailed view of where buying and selling pressure is concentrated at specific price levels.
Understanding the Volume Heatmap and CVD
The Volume Heatmap tracks trading volume across price ranges. When the price lingers in a certain zone or moves sharply, the background color brightens. These brighter areas often act as potential support or resistance, as they represent levels where significant trading activity has occurred. On May 15, several such zones were visible, indicating where market participants have previously shown interest.
The Cumulative Volume Delta (CVD) indicator breaks down buy and sell orders by size. The yellow line tracks orders ranging from $100 to $1,000, while the brown line represents larger institutional-sized orders between $1 million and $10 million. As buy orders increase, these lines rise, providing a clear visual of order flow imbalance.
Key Observations from the May 15 Data
At the time of the snapshot, the CVD lines showed a slight upward tilt for smaller orders, suggesting steady retail buying interest. The brown line, representing large orders, remained relatively flat, indicating a lack of aggressive institutional accumulation at current levels. This divergence between retail and large-order flow may signal caution among larger market participants.
The Volume Heatmap highlighted a concentration of activity around the $62,000 to $63,000 range, with brighter zones appearing just below $61,500. These levels could serve as near-term support, while a cluster of volume above $64,000 may act as resistance if the price attempts to move higher.
What This Means for Traders
For traders monitoring BTC spot markets, the CVD chart provides a granular look at order book dynamics. The lack of large buy orders at current levels suggests that any upward move may lack strong institutional backing, making a breakout above $64,000 less certain. Conversely, the presence of retail buying could help stabilize prices near support zones.
This data is particularly useful for short-term traders looking to gauge market sentiment and identify potential entry or exit points. However, CVD analysis should be used alongside other indicators, as order book data can shift rapidly with new market events.
Conclusion
The BTC spot CVD chart as of May 15, 5:00 p.m. UTC, indicates a market where retail buying is present but large institutional orders remain subdued. Key support and resistance levels are visible through the Volume Heatmap, offering traders actionable insights for the sessions ahead. As always, market conditions can change quickly, and CVD data represents just one piece of the broader trading puzzle.
FAQs
Q1: What does the Cumulative Volume Delta (CVD) indicator show?
The CVD indicator tracks the difference between buy and sell orders in the order book, categorized by order size. It helps traders see whether buying or selling pressure is dominant at current price levels.
Q2: How is the Volume Heatmap used in trading?
The Volume Heatmap highlights price levels where significant trading volume has occurred. Brighter areas indicate zones of high activity, which can act as support or resistance when the price returns to those levels.
Q3: Why are large orders (brown line) important?
The brown line tracks orders from $1 million to $10 million, typically associated with institutional traders. Changes in this line can signal shifts in large-scale market sentiment, often preceding major price moves.
This post BTC Spot CVD Chart Analysis: Key Support and Resistance Levels from May 15 Data first appeared on BitcoinWorld.


추천 콘텐츠

Pi Network Fixes Technical Issue, Rewards Remain Safe
XRP Price Forecast: Could XRP Reach $15 Within Five Years?