

Bitcoin Price Falls Below $82K as Treasury Yields Rise
Bitcoin slipped back below the $82,000 resistance level as rising U.S. Treasury yields tightened liquidity across risk markets, putting renewed pressure on crypto prices.
The move came as Treasury yields climbed to fresh highs, drawing capital toward government bonds and away from speculative assets. For Bitcoin holders, the failed push above $82,000 signals that macro headwinds are currently outweighing crypto-specific demand.
How rising Treasury yields squeeze Bitcoin
Treasury yields represent the return investors earn by lending money to the U.S. government. When those yields rise, bonds become more attractive relative to assets like Bitcoin that produce no income. Money flows toward the safer, higher-yielding option.
Liquidity, in simple terms, is the amount of easy money sloshing around in financial markets. When yields rise, central bank policy tends to stay tight, and that liquidity shrinks. Less available capital means fewer dollars chasing risk assets, including crypto.
The U.S. Treasury’s daily yield curve data shows the upward trend across multiple maturities. As yields grind higher, Bitcoin faces a headwind that has nothing to do with blockchain fundamentals.
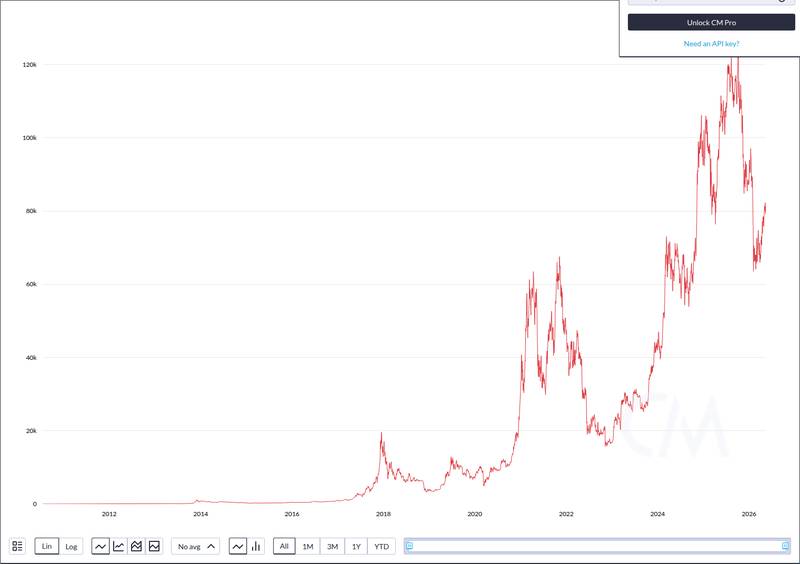 CoinMetrics blockchain-data panel highlighting the structural trend discussed for bitcoin.
This dynamic is not unique to 2026. Bitcoin has historically struggled during periods of rising real yields, as institutional allocators rotate into fixed income. The current environment, with the Treasury actively managing its issuance calendar, adds another layer of supply pressure in the bond market.
Why $82,000 is a level worth watching
In market terms, resistance is a price level where selling pressure has repeatedly overwhelmed buyers. Bitcoin approached $82,000 and failed to hold above it, suggesting that sellers are clustered around that zone.
A failed breakout above resistance often triggers additional selling as short-term traders exit positions. This is especially relevant for newer holders who may have bought near recent highs, as the majority of top traders on platforms like Hyperliquid have been positioned long, making a rejection at resistance painful for leveraged longs.
The $82,000 level is not a permanent ceiling. It is a checkpoint. If Bitcoin reclaims and holds above it on a subsequent attempt, the failed breakout becomes a shakeout. If it continues to reject, the level strengthens as resistance.
What to watch from here
The most important variable for Bitcoin right now is not on-chain. It is macroeconomic. Traders should monitor Treasury yields and any signals from the Federal Reserve about liquidity conditions before assuming this pullback is purely crypto-driven.
Regulatory developments could also shift the landscape. The CLARITY Act moving through the Senate and Poland’s recent approval of its MiCA crypto bill represent structural progress for the industry, but neither will override a macro liquidity squeeze in the short term.
The practical checkpoint is straightforward: watch whether Bitcoin can reclaim $82,000 on its next attempt. A clean break above with volume would suggest the macro drag is fading. Continued rejection would indicate that rising yields still have the upper hand.
Disclaimer: This article is for informational purposes only and does not constitute financial or investment advice. Cryptocurrency and digital asset markets carry significant risk. Always do your own research before making decisions.


추천 콘텐츠

Augustus Wins OCC Approval to Build AI-Powered Stablecoin Bank

Pi Network SCP Protocol V23 Upgrade Sparks Massive Excitement


