

Strategy stock holds the 50-day as MSTR stays capped below resistance

Strategy stock (MSTR) holds the 50‑day but stays capped below near‑term resistance, as intraday pressure lingers and the daily close at 165.81 remains under the 20‑day EMA.
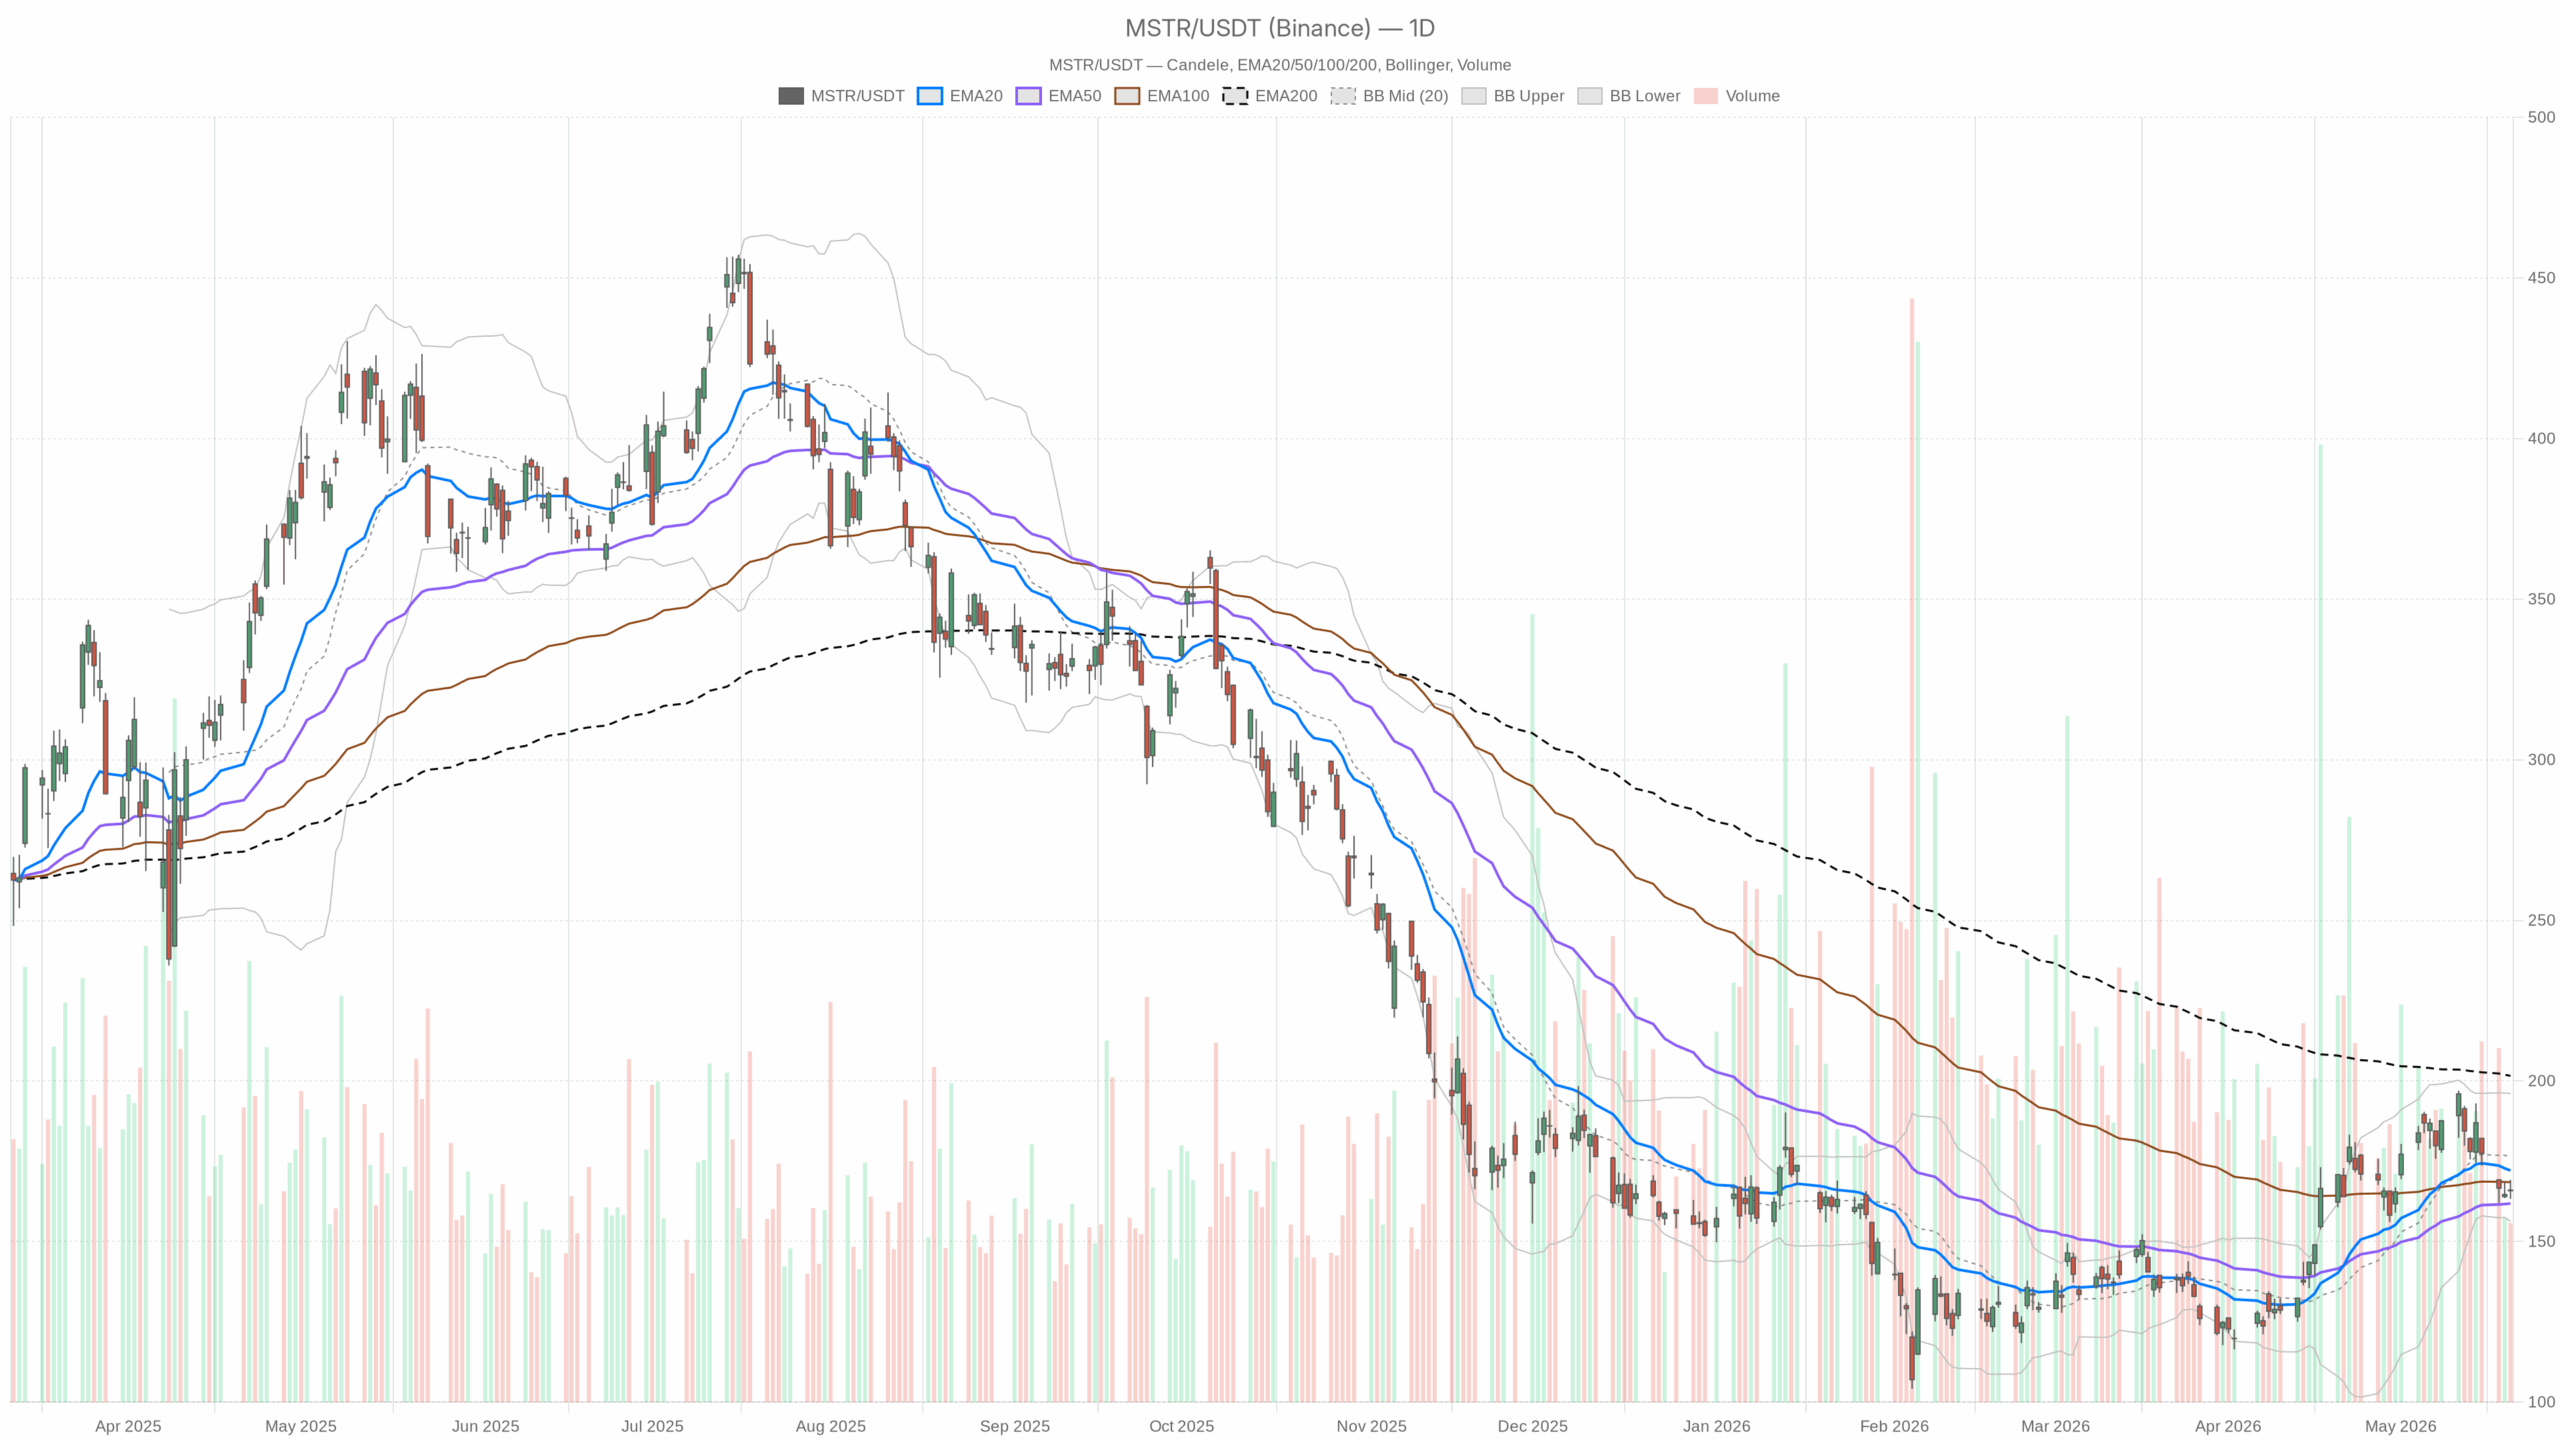 MSTR — daily chart with candlesticks, EMA20/EMA50 and volume.
Strategy stock (MSTR) overview and news cross‑currents
Meanwhile, the news flow keeps the tape jumpy. MSTR fell alongside Bitcoin’s pullback to a two‑week low, and the plan to repurchase $1.5 billion of convertible notes—potentially funded by selling some Bitcoin—added headline risk.
At the same time, analysts have lifted price targets on continued Bitcoin accumulation, which offsets part of the bearish narrative. Therefore, the cross‑currents help explain the choppy range in MSTR stock.
Daily technical outlook for Strategy stock
On the daily chart, price structure is mid‑range. The 20‑day EMA at 172.12 sits above spot, the 50‑day at 161.83 sits below, and the 200‑day at 201.58 remains well overhead. Interpretation: medium‑term trend support holds, but the near‑term ceiling remains intact.
Notably, the daily RSI14 prints 48.09. Interpretation: momentum is muted and not yet trending. The daily MACD histogram is −3.51 with the line (5.02) below the signal (8.53). Interpretation: bearish pressure persists, but it is not accelerating.
Daily Bollinger Bands show a mid at 176.2, upper 196.1, and lower 156.3. In turn, price sits in the lower half of the envelope, leaving room for mean reversion higher or a drift toward the lower band if support breaks.
Meanwhile, daily ATR14 is 11.34, indicating elevated realized volatility for a single‑name stock at this price. The daily pivot is 166.1 with R1 at 168.94 and S1 at 162.97. Therefore, the close just under the pivot keeps the burden on buyers; R1 marks near‑term resistance while S1 and the 50‑day EMA cluster as first support.
Intraday 1‑hour structure
On the 1‑hour chart, the intraday tone is cautious. Price sits below the 20‑hour EMA (168.00), the 50‑hour (172.71), and the 200‑hour (167.63). Interpretation: rallies face supply until these levels are reclaimed, especially the 200‑hour.
Hourly RSI14 is 40.61, so buying power remains soft. The hourly MACD histogram is +0.74 with the line (−2.27) above the signal (−3.01). In other words, downside momentum is easing, but the trend has not turned up.
Hourly Bollinger mid/upper/lower are 165.65/168.76/162.55. Notably, price is coiling near the mean, with the upper band aligning near first resistance. Hourly ATR14 is 2.45, keeping intraday ranges broad. The hourly pivot at 166.11 with R1 166.72 and S1 165.22 frames the session; repeated failure at the pivot favors tests of S1.
15‑minute execution window
In the 15‑minute view, the regime is bearish. Price sits under the 20‑EMA (166.92), the 50‑EMA (167.10), and well under the 200‑EMA (173.61). Therefore, fades into 166.9–167.1 remain likely unless momentum flips.
Meanwhile, the 15‑minute RSI14 is 42.02, showing subdued short‑term momentum. The 15‑minute MACD histogram is −0.26 near the zero line, implying no clean thrust either way yet. Bands print 167.29/168.95/165.63 with price near the lower band, so a minor bounce is possible, but trend pressure persists.
The 15‑minute pivot at 166.03 with R1 166.56 and S1 165.30 is tight. Notably, S1 near 165.3 aligns with the hourly S1 at 165.22, forming a tactical support zone.
Scenarios and trigger levels for Strategy stock
Therefore, the main scenario is neutral on the daily timeframe with a negative tilt. Price remains trapped below the 20‑day EMA and the daily pivot while holding the 50‑day. The hourly profile corroborates that caution, as the 200‑hour EMA caps price and momentum is only stabilizing, not reversing.
For the bullish case, buyers need to reclaim the daily pivot at 166.1 and then push through the hourly 200‑EMA at 167.63 and daily R1 at 168.94. That sequence would show control shifting to the upside. A follow‑through above the 20‑day EMA at 172.12 would open a run toward the daily Bollinger mid at 176.2. Confirmation would come from the daily RSI moving sustainably above 50 and the MACD histogram turning positive. News‑wise, steadier Bitcoin and clarity on the convert buyback funding would reduce overhead supply fears.
On the other hand, the bearish path strengthens if 165.22–165.30 breaks intraday and the daily S1 at 162.97 gives way. In that case, risk would shift toward the 50‑day EMA at 161.83 and potentially the lower Bollinger band at 156.3. The bullish case would be invalidated by a decisive daily close below the 50‑day EMA. Bearish confirmation would include a daily RSI pressing into the low‑40s and a deeper negative MACD histogram. Continued Bitcoin softness and any actual Bitcoin sales to fund the buyback would amplify that risk.
Positioning and risk context
Overall, respect a two‑sided, high‑volatility tape with clear trigger levels in Strategy stock. Until the daily chart retakes the 20‑day EMA and hourly trend lines, bounces are vulnerable to supply near 167–169. Conversely, a clean loss of 163 and then the 50‑day would likely invite another volatility spike. Levels—not narratives—should drive risk management.


추천 콘텐츠

Ripple (XRP) News Today: May 21

Dollar Holds Near Six-Week Peak as Iran Deal Optimism Builds

Brent Crude Edges Higher as Market Digests Iran Headline Risks – ING


인기 뉴스
더보기
