

ZEC’s Post-$700 Collapse Raises New Questions for Traders
ZEC trades near $700 resistance after a 74% crash, with RSI overheated and key support levels at $542, $350, and $200.
Zcash has returned to a key technical zone after a sharp cycle of gains and losses.
The token is trading near $664 on the 1D Binance chart, close to the prior resistance area near $700.
The latest setup has raised new questions for traders after ZEC previously fell more than 74% from its upper range.
ZEC Returns Near The $700 Resistance Zone
ZEC’s recent move has brought the token back near a major higher-timeframe resistance zone.
The chart places this area around $699.67, with price trading close to $664. A previous analysis had marked the $700 region as a key risk zone.
The token later dropped from around $750 to $185 between November 2025 and February 2026.
The move represented a decline of more than 74% from that upper range. That drop remains central to the current market debate around ZEC price action.
The analyst described the latest view as “awareness analysis” rather than a direct short signal. The note also warned against high-leverage long positions in a corrective market.
Fibonacci Levels Show Key Support Areas
The Fibonacci retracement on the 1D chart uses a low near $32.78 and a high near $699.67. ZEC has moved above the 0.236 level near $542.29.
That level is now the first major support area on the chart. A move below it could shift focus toward deeper retracement levels.
The next support zones sit near $444.92 and $366.22. These match the 0.382 and 0.5 Fibonacci levels on the chart.
The 0.618 level is near $287.53, while the 0.786 level is near $175.49. The analyst also listed $350, $200, and $150 as radar levels.
A daily or higher-timeframe close above the old high could change the structure. The analyst placed invalidation at any higher-timeframe candle closing above $760.
CoinMarketCap data shows Zcash trading at $668.79, down 0.83% in 24 hours. Its market cap stands at $11.15B, while daily volume is $1.04B.
ZEC has a circulating supply of 16.68M coins, with a max supply of 21M. Its FDV is listed at $14.04B.
Read Also:
Momentum Indicators Show A Stretched Market
The MACD remains above zero on the daily chart. The MACD line is near 60.53, while the signal line is near 55.82.
The histogram is positive near 4.72, but expansion appears limited. This suggests momentum remains active, though strength may be slowing near resistance.
The RSI is near 71.93, while its moving average is close to 69.67. This places ZEC near overbought territory on the daily chart.
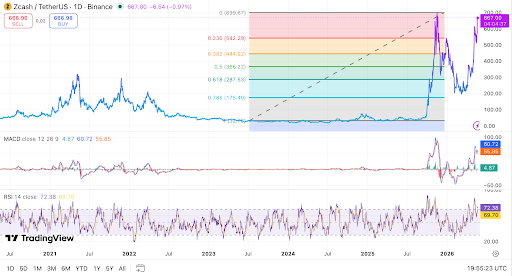 ZEC nears $700 resistance as RSI shows overbought market conditions.Source: TradingView
An RSI above 70 often shows strong demand, but it can also show a stretched market. Traders usually watch for cooling before making new entries.
The analyst marked $680 to $750 as a high-risk short entry zone. Targets were listed at $350, $200, and $150, with a stop on any higher-timeframe close above $800.
ZEC’s current setup remains centered on the $700 zone.
A confirmed breakout may support another move toward $1,000, while rejection could bring support tests. The analyst added, “TA Only. Not Financial Advice. ALWAYS DYOR.”
The post ZEC’s Post-$700 Collapse Raises New Questions for Traders appeared first on Live Bitcoin News.


추천 콘텐츠

Egypt finds new gas and oil reserves in Western Desert

Nexpace Commits $10M to NXPC Buyback Program for Ecosystem Stability

Tesla Model 2 Release Date: Everything You Need to Know About Tesla's Most Affordable EV


인기 뉴스
더보기
