

Dogecoin (DOGE) Eyes Breakout: Falling Wedge Pattern Signals Potential Rally
Key Highlights
- DOGE maintains a trading range between $0.1014 and $0.1026, staying firm above the critical $0.10 threshold.
- Technical analysts have identified a falling wedge formation that typically precedes upward price movement.
- Institutional interest remains strong with $860,960 in net inflows to DOGE spot ETFs during the previous week.
- Critical resistance level identified at $0.1050, with successful breach potentially driving price toward $0.1100 and subsequently $0.1150.
- Technical observers suggest a potential weekly bottom formation, while flagging $0.0883 as the critical downside level should current support collapse.
Dogecoin maintained its position above the psychologically important $0.10 threshold throughout Tuesday’s trading session as cryptocurrency markets experienced broader weakness. The popular meme token changed hands at $0.10259, reflecting a modest 0.74% decline over the preceding 24-hour period, while trading volume surged 31% to reach $719.25 million—indicating sustained market participant engagement.
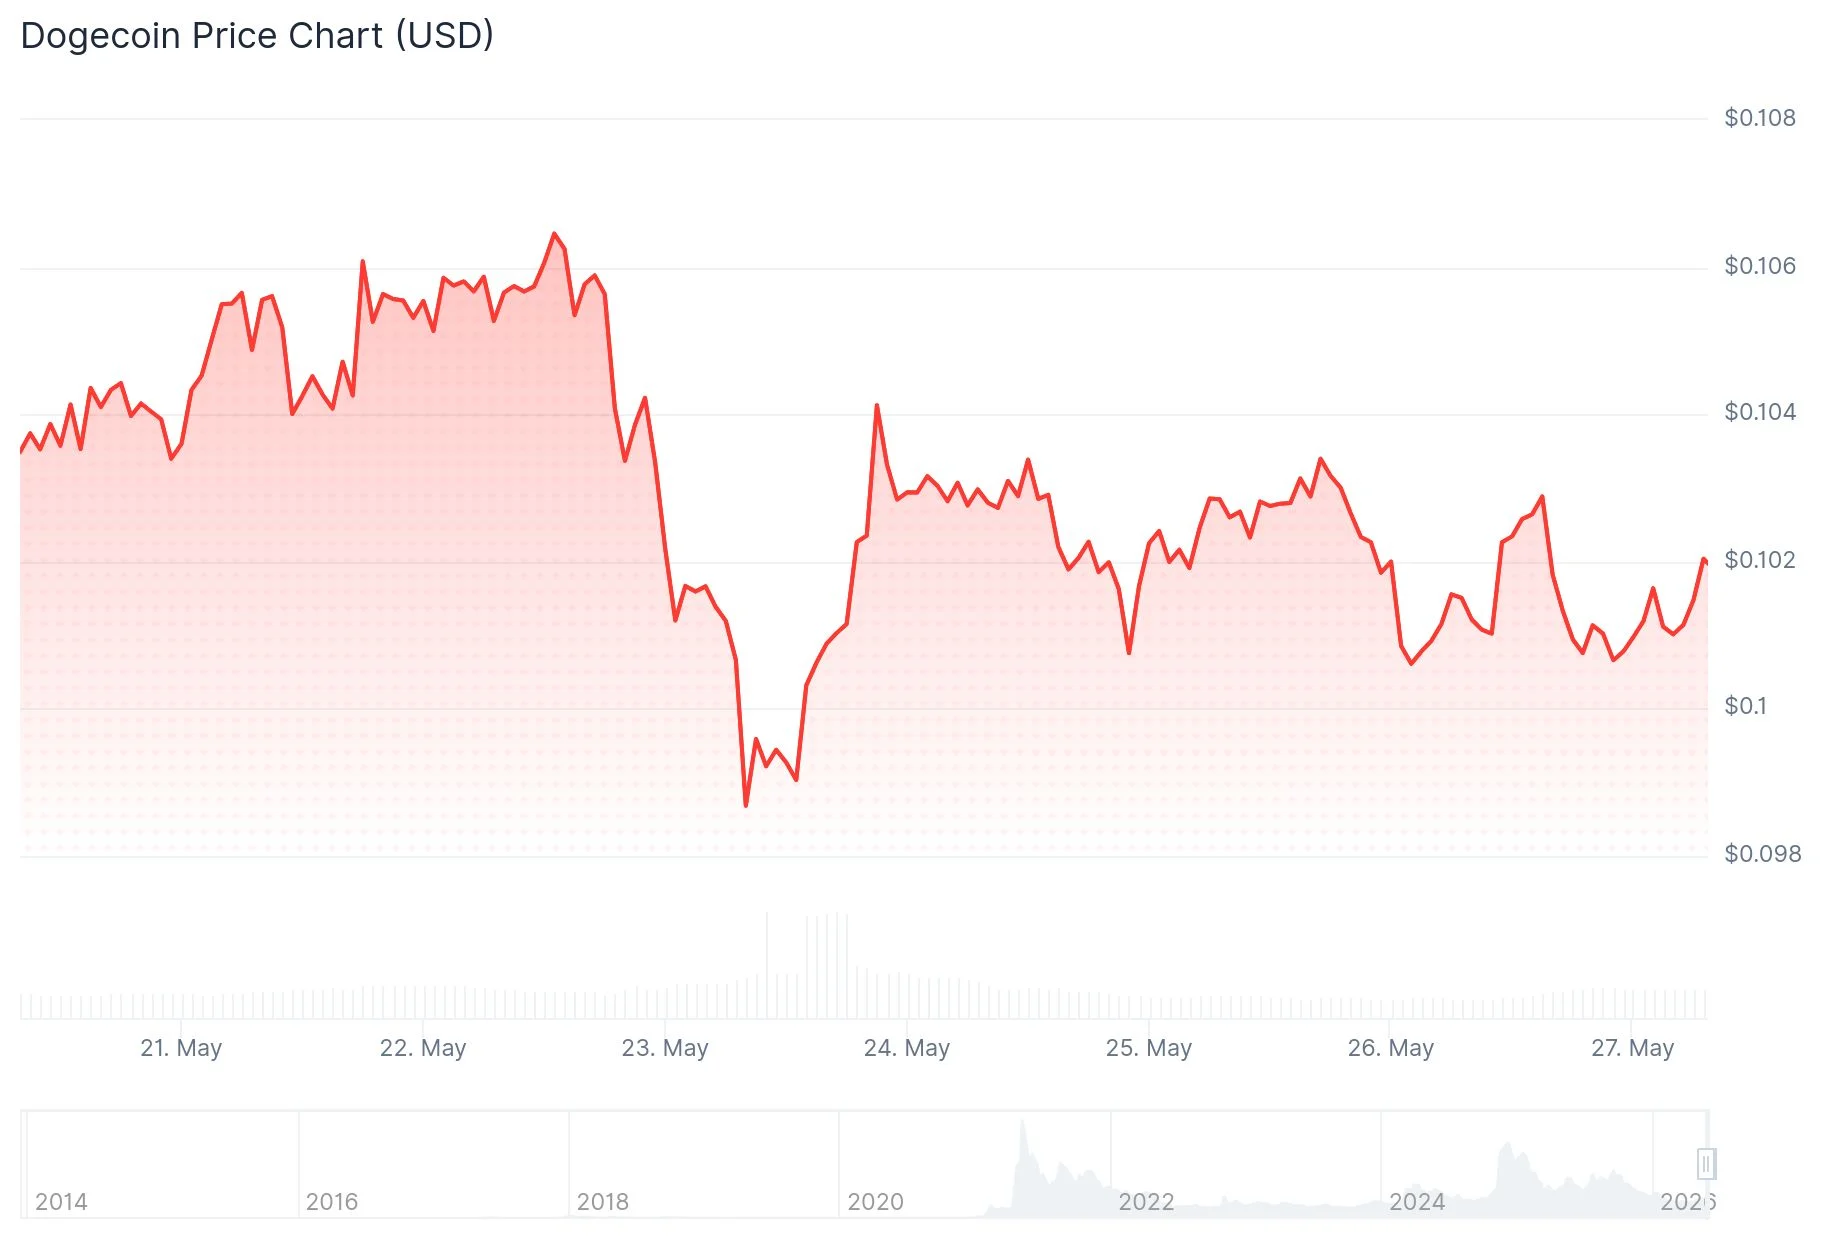 Dogecoin (DOGE) Price
The cryptocurrency sector as a whole contracted 1.33% during this timeframe, driving aggregate market capitalization down to $2.56 trillion. Bitcoin experienced a 1.01% retreat to $76,866, creating downward pressure across alternative cryptocurrencies, including DOGE.
Market sentiment turned cautious following new U.S. military defensive operations targeting Iran, prompting investors to reduce exposure to riskier assets. Meme-based cryptocurrencies experienced particularly pronounced weakness amid this risk-averse environment.
Nevertheless, Dogecoin continued demonstrating appeal among institutional allocators. According to Sosovalue analytics, DOGE spot exchange-traded funds maintained their positive momentum with four consecutive weeks of net capital inflows. The most recent week registered $860,960 in additions, underscoring persistent demand from professional investment entities.
Technical Formation Captures Market Attention
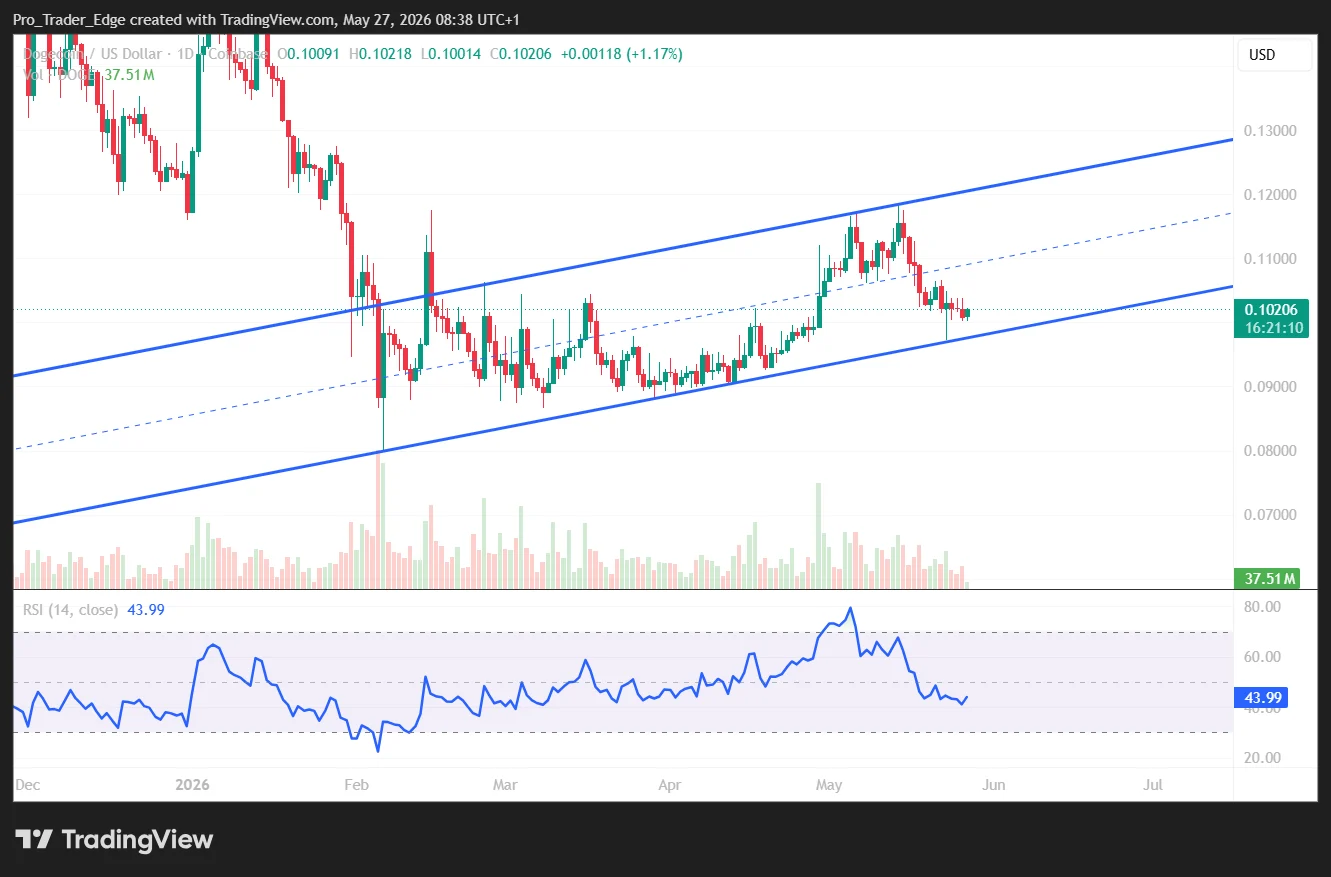
Cryptocurrency market analyst Trader Tardigrade observed that DOGE has been consolidating within a falling wedge configuration over recent weeks. This technical setup features converging trendlines as price action compresses, frequently preceding significant directional moves.
Historically, this pattern resolves with upward momentum. Market participants are monitoring for a decisive move above wedge resistance, which would provide an early indication of bullish momentum gathering strength.
Examining the 4-hour timeframe reveals price currently positioned at $0.1014 with nearby resistance stationed at $0.1050. Breaking through this barrier would clear the pathway toward $0.1100, while sustained buying pressure could extend gains to $0.1150—a level that previously acted as resistance during early April.
 Source; TradingView
The Relative Strength Index registers approximately 44.50, indicating subdued momentum without reaching oversold territory. The MACD indicator displays slight bearishness, though the histogram suggests potential stabilization may be developing.
Critical Support Zones Under Scrutiny
Analyzing the daily timeframe, market technician Ali Charts identified the $0.1020–$0.1027 region as a significant support zone. This area coincides with the channel’s median line and the 50-day simple moving average, reinforcing its technical significance.
DOGE recently retreated from the upper boundary of its multi-week channel near $0.1156. This level now represents the primary upside objective should buyers successfully defend current support.
Should support fail to hold, Ali Charts identified the lower channel boundary near $0.0883 as the subsequent downside target.
On the weekly chart, analyst Moe identified a pattern resembling the bottom structure observed in 2024. DOGE has advanced above a declining trendline, with the current chart displaying a rounded base formation developing through 2026.
Moe characterized the present zone as a possible local floor. DOGE is currently testing three-month resistance, requiring a breakout above this band to validate a more substantial upward trajectory. Failure to breach this zone would maintain DOGE within its established trading range.
DOGE spot ETFs most recently recorded $860,960 in weekly inflows, marking four straight weeks of positive institutional investment.
The post Dogecoin (DOGE) Eyes Breakout: Falling Wedge Pattern Signals Potential Rally appeared first on Blockonomi.


추천 콘텐츠

Hyperliquid Climbs Into Crypto’s Top 10 Despite U.S. Geoblock

Glassnode Warns Nearly 30% Of Bitcoin Supply Could Face Future Quantum Risks
Bitcoin Price News: BTC at Risk of Falling to $70K as Crypto Veteran Calls for 50‑60K in Coming Months


인기 뉴스
더보기
