

Silver Price Forecast: Market Consolidation Continues After Historic Rally
Key highlights:
- Silver cools after a major rally, with price action weakening below key moving averages.
- Momentum indicators show sellers still active despite a brief bounce from support.
- The long-term cycle remains intact, backed by industrial demand and structural supply pressure.
Silver is currently in a cooling period following one of the best rallies in the past few years. The silver price has rallied from the range of $45-$50 to above $100 before losing traction.
As expected, such a rally will have the effect of causing traders to take profits, especially with the silver prices trading below moving averages. The overall outlook remains bullish over a longer period, although the current scenario is a correction period.
Silver price struggles around key technical levels
We had a look at the chart from $Trader, and the reaction around the 100 EMA stands out. Price bounced from that zone, forming a bullish kicker candle, which usually signals buyers trying to step back in.
The problem is that there was no follow-up strength the next day, which shows momentum is still weak. The silver price is also trading under several moving averages, including a short-term bearish cross that keeps pressure on recovery attempts.
Momentum indicators back this up. RSI is sitting near 47, which is neutral and doesn’t show oversold conditions yet. MACD is still expanding lower without a bullish crossover, and rate of change has been trending down for about two weeks. That combination tells us sellers are still active beneath the surface, even after the bounce from support.
Silver price long-term picture still strong
Looking beyond the short-term pullback, the bigger story for silver is very different. Historical annual data shared by BaldGuyMoney shows how long silver stayed quiet between 1990 and 2005, mostly stuck between $4 and $6.
That changed in the 2006–2011 cycle, when silver ran hard up to $35.56 during the global financial crisis period. After that, it spent years in consolidation between $14 and $20 from 2012 through 2020.
The most dramatic move came in 2025–2026, where the silver price reached an average of $91.73 in 2026. That break above the 2011 high confirmed a major long-term structural change.
Demand from industrial sectors like solar, EVs, and electronics has played a big role, along with silver’s ongoing use as a monetary hedge alongside gold. Supply constraints from years of underinvestment have also added pressure in the background.
Silver price outlook from here
In the short term, the key zone traders are focused on the $75.61 to $76.00 level. That area has acted as support during the current pullback. If it breaks, the next area to watch is $67.69, which is a deeper historical support zone.
On the upside, recovery needs to clear $80–$82 first, before any push toward the $85+ region becomes realistic again. The silver price is still inside a larger bullish cycle, even with the current correction. Silver tends to move in waves, and deep pullbacks are not unusual even during strong long-term uptrends.
According to CoinCodex’s 1-month silver price prediction, the price could move toward $78.48, which is above current levels and indicates that some analysts still expect a recovery attempt if buyers continue defending the key support zones around the mid-$70s range.
Plus500: Best CFD trading platform for global investors
- Trade 2,800+ CFDs – stocks, forex, indices, commodities, crypto & more
- 0% commission and competitive spreads with no hidden fees
- Leverage up to 1:30 for retail clients and higher for professionals (professional accounts do not have ICF rights)
- Advanced risk management tools
- Regulated in multiple jurisdictions, ensuring security & compliance
- 26+ million users worldwide
Get Started on Plus500
CFDs are complex instruments with a high risk of losing money due to leverage. 80% of retail investors lose money trading CFDs with this provider. Ensure you understand the risks before trading. Past performance is not indicative of future results. Professional accounts do not have ICF rights.


추천 콘텐츠

Hyperliquid Climbs Into Crypto’s Top 10 Despite U.S. Geoblock

Glassnode Warns Nearly 30% Of Bitcoin Supply Could Face Future Quantum Risks
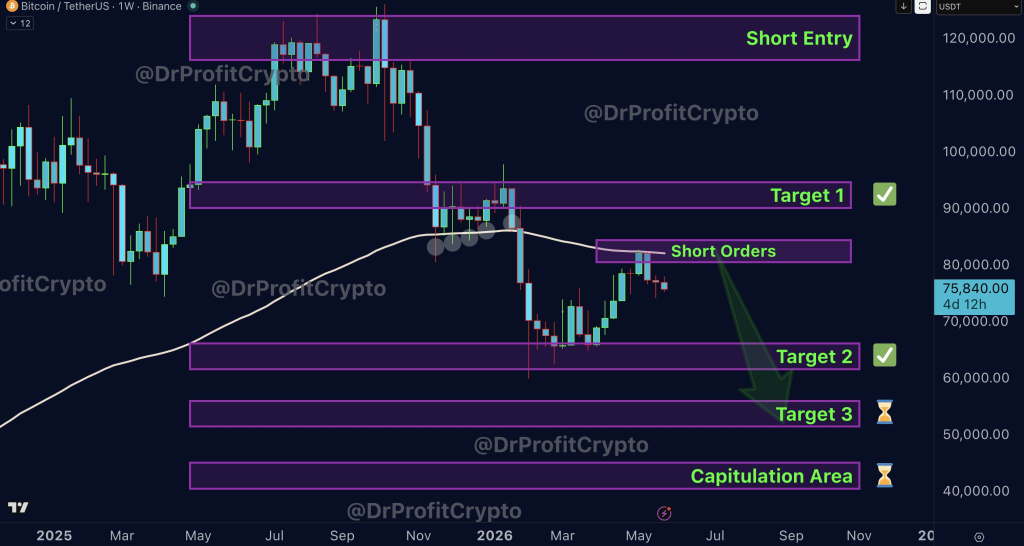
Bitcoin Price News: BTC at Risk of Falling to $70K as Crypto Veteran Calls for 50‑60K in Coming Months


인기 뉴스
더보기
