-
After a 20% correction, the Cardano bulls have triggered a rebound, but continue to remain under bearish pressure
-
While ADA's weekly chart points to long-term accumulation, the daily chart suggests short-term bearish momentum still favors sellers.
Cardano is trading at a critical turning point as the ADA price continues to hover around the long-standing support zone near $0.23. While the weekly chart suggests buyers are defending a key floor that has historically triggered rebounds, the daily chart paints a different picture, showing persistent bearish pressure and weakening momentum. This divergence between the short-term and long-term outlook could determine ADA’s next major move.
ADA Defends a Multi-Year Support Zone on the Weekly Timeframe
Cardano (ADA) is trading at a crucial long-term support zone after experiencing months of sustained selling pressure. The weekly ADA chart shows the cryptocurrency consolidating near the $0.23 region, an area that previously acted as a strong accumulation zone throughout 2023 and helped initiate a broader recovery phase.
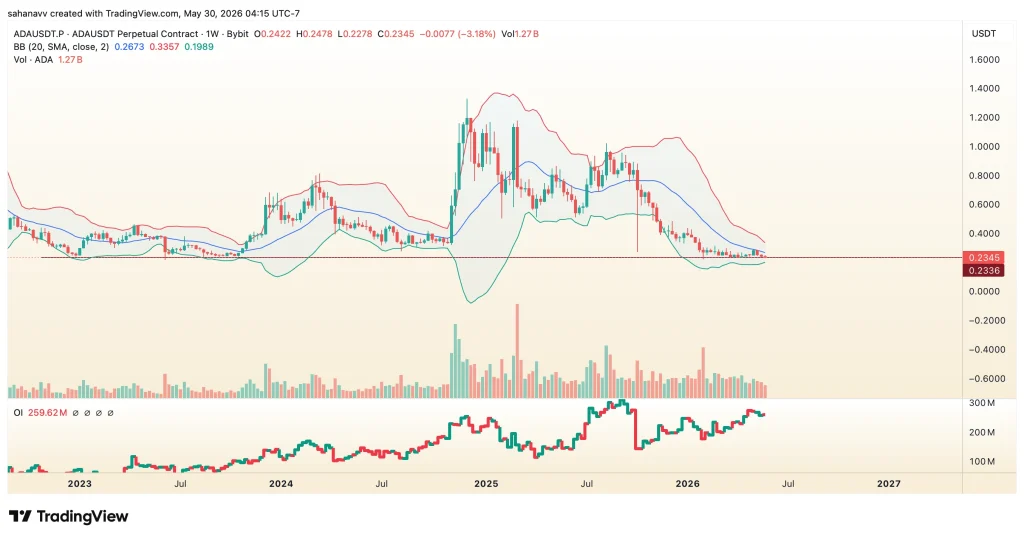
The Bollinger Bands themselves have contracted significantly, indicating a prolonged period of volatility compression that often precedes a major directional move. At the same time, the price remains trapped within a broader downtrend structure, keeping the long-term trend under bearish influence. However, open interest has steadily climbed toward cycle highs despite ADA trading near multi-year support. This combination of rising speculative activity, compressed volatility, and a historically significant support zone suggests the market could be approaching a decisive breakout or breakdown phase in the weeks ahead.
Key Levels to Monitor
- Immediate Support: $0.23
- Major Support Zone: $0.22–$0.24
- Bollinger Band Basis Resistance: $0.267
- Upper Bollinger Band Resistance: $0.335
- Psychological Resistance: $0.40
- Bullish Trend Reversal Zone: Above $0.335
- Bearish Invalidation Level: Below $0.22
Daily Chart Signals Persistent Bearish Pressure Despite Long-Term Support Holding
The ADA price has been trading within a descending parallel channel for several months, consistently forming lower highs and lower lows. Recent recovery attempts toward the upper boundary of the channel have been rejected, pushing the token back toward the lower trendline support near $0.23. This repeated failure to sustain higher levels indicates that buyers remain cautious despite ADA approaching a historically significant support region.
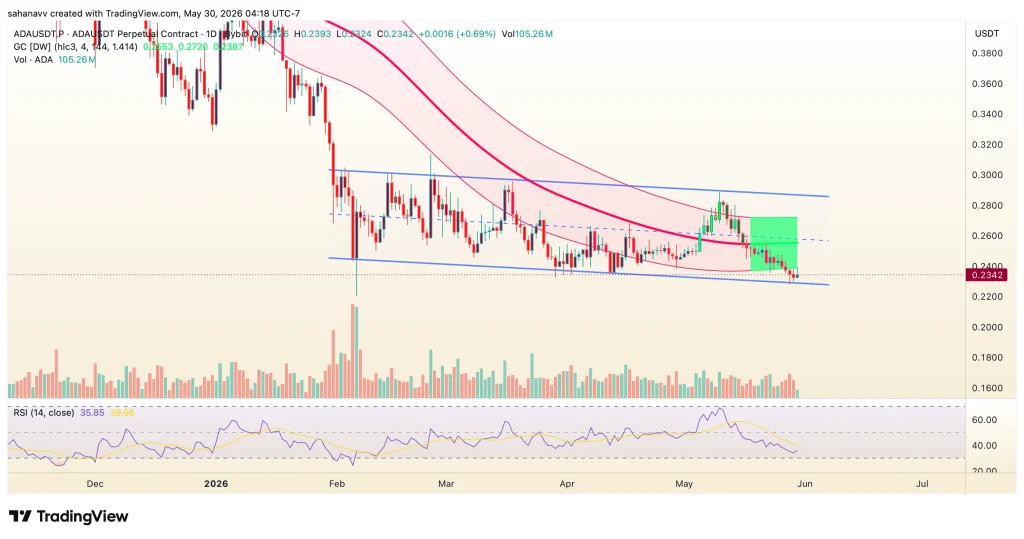
The Gaussian Channel is bullish, with ADA trading below the channel’s median resistance and struggling to reclaim momentum. The recent rejection from the channel’s upper boundary suggests sellers remain active on rallies, limiting the potential for an immediate recovery. Meanwhile, the Relative Strength Index (RSI) has slipped toward the oversold region and is currently trying to validate a bullish divergence. As a result, ADA appears trapped between weakening momentum and a critical support level, setting the stage for a decisive move in either direction.
Key Levels to Monitor
- Immediate Support: $0.23
- Channel Support Zone: $0.22–$0.23
- Immediate Resistance: $0.255
- Gaussian Channel Midline: $0.272
- Descending Channel Resistance: $0.28–$0.29
- Major Breakout Zone: Above $0.30
- Bearish Breakdown Level: Below $0.22
Weekly Support vs Daily Weakness: What Could Be Next for ADA Price?
Cardano price appears to be approaching a pivotal moment as its short-term and long-term technical structures continue to send conflicting signals. On the weekly timeframe, ADA remains firmly positioned above a multi-year support zone, while rising open interest and compressed Bollinger Bands suggest that a significant move could be on the horizon.
In contrast, the daily chart continues to reflect bearish pressure, with ADA trading within a descending channel, the Gaussian Channel maintaining a negative bias, and RSI remaining below the neutral threshold. This suggests that sellers retain control of the short-term trend, even as long-term support remains intact.
As a result, the next major move in ADA will likely depend on which timeframe gains control. A recovery above key resistance levels around $0.255 and $0.27 could signal that buyers are regaining momentum and support the case for a broader trend reversal. On the other hand, a breakdown below the $0.22 support zone would invalidate the bullish long-term thesis and expose the token to further downside risk. Until then, ADA remains locked in a battle between long-term accumulation and short-term bearish momentum, making the current price range one of the most critical areas to watch in the weeks ahead.