SHIB Price Meltdown: Why the Worst May Be Yet to Come?
The Shiba Inu price has been grinding lower on the daily chart, and fresh U.S. economic data only adds fuel to the bearish fire. August’s Bureau of Economic Analysis release shows income growing at just 0.4 percent while personal consumption outpaced that at 0.6 percent. The savings rate dropped to 4.6 percent. In plain terms, Americans are spending more than they’re earning, relying on savings buffers that are already thinning. Risk assets like SHIB thrive when consumers and retail investors have excess liquidity, but this report signals the opposite: money is tightening, and speculative flows are drying up.
Shiba Inu Price Prediction:Why SHIB Price Is Under Pressure Today?
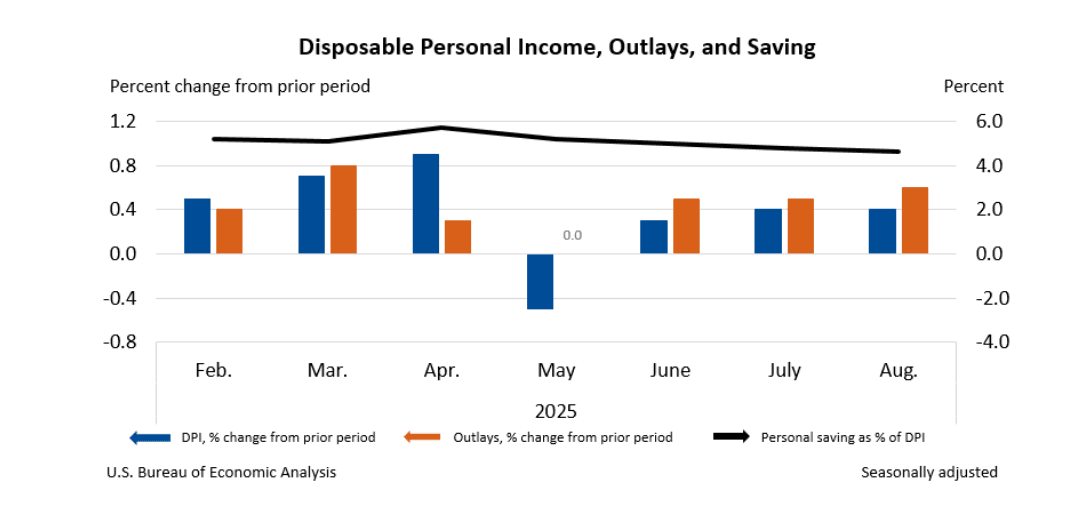
The latest macro update reinforces the headwinds already hitting SHIB price. Rising consumer spending alongside higher PCE inflation (0.3 percent in August) suggests the Federal Reserve won’t pivot dovish anytime soon. That means higher borrowing costs stay in play, which directly impacts retail-driven tokens like Shiba Inu. Shiba Inu price has historically surged when meme coin appetite aligns with loose liquidity cycles. This environment looks like the reverse: tighter liquidity, lower savings, and cautious risk sentiment.
Shiba Inu Price Prediction:Daily Chart Breakdown
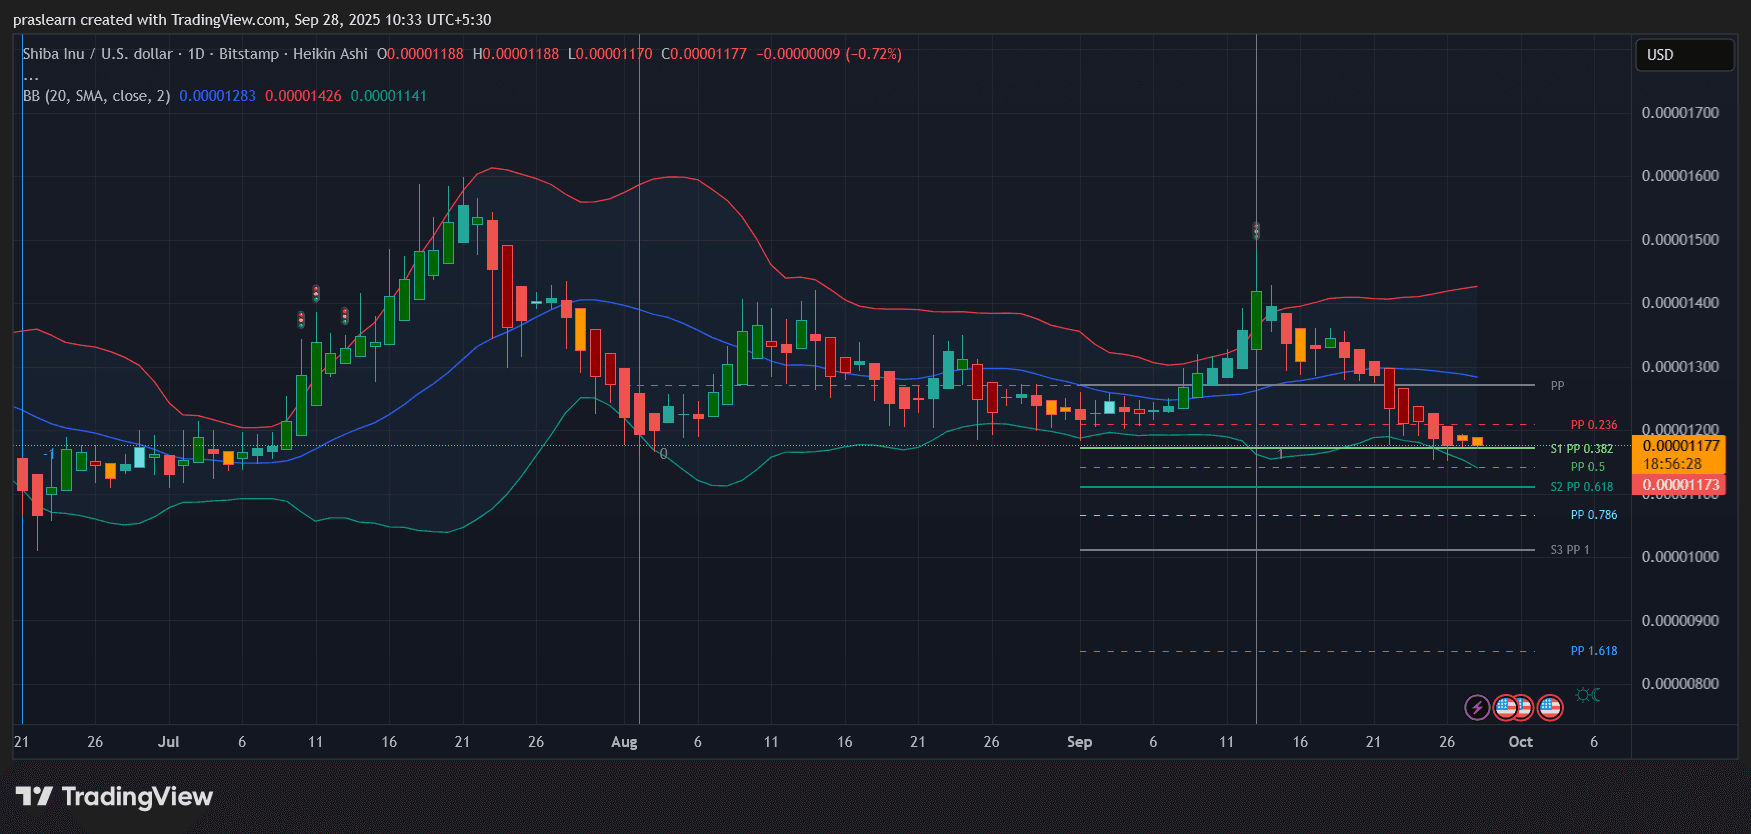 SHIB/USD Daily Chart- TradingView
The daily SHIB/USDT chart paints a stark picture:
- Trend direction: The token has been locked in a descending channel since mid-September, trading below both the 20-day moving average and the midline of the Bollinger Bands.
- Support levels: Immediate support rests at 0.00001140 (S1 pivot) and deeper at 0.00001100. If those break, Fibonacci S2 at 0.00001080 and the 0.786 retracement near 0.00001020 come into play.
- Resistance levels: The first hurdle is 0.00001230, where the 20-day SMA and upper Bollinger midline converge. Only a breakout above 0.00001300 would suggest buyers are regaining control.
- Momentum: Red candles dominate with shrinking upper wicks, showing sellers in control but exhaustion signs creeping in. The Bollinger Bands are widening, pointing to volatility expansion downward.
Macro Meets Meme: Why This SHIb Price Crash Has More Weight?
The August report reveals that real disposable income barely grew at 0.1 percent, while real PCE advanced at 0.4 percent. Inflation at 2.7 percent year-over-year locks the Fed into caution. For SHIB, which relies on retail hype and liquidity inflows, this backdrop means less discretionary cash chasing speculative trades. Meme tokens often act like the first domino to fall when retail wallets tighten, and the current data highlights just that scenario.
Shiba Inu Price Prediction: What Happens Next for SHIB Price?
- Bear case: A clean break below 0.00001100 could send SHIB toward 0.00000950, a level not seen since early summer. This aligns with pivot S3 support and would represent a 20 percent drawdown from current prices.
- Neutral case: If buyers hold the 0.00001140–0.00001100 zone, SHIB may consolidate sideways before any relief bounce. A bounce here would be corrective, not trend-changing.
- Bull case: Only a decisive reclaim of 0.00001300 with volume can shift momentum. Without macro support, that’s a low-probability scenario for now.
Bottom Line
The $SHIB crash isn’t just a technical story—it’s being reinforced by macroeconomic reality. As personal savings fall and consumer spending climbs faster than income, retail speculation weakens. SHIB price is already at key support, and unless conditions shift, the path of least resistance is lower. Traders should prepare for deeper downside unless the token proves otherwise with a breakout above the 0.00001300 level.
추천 콘텐츠

Pi Network Surges 35.9% Weekly: On-Chain Data Reveals Unexpected Accumulation Pattern

IRS Sets Course for Digital-Only Tax Reporting for Cryptocurrency Users