

Ethereum Ready For Round 2? Analyst Forecasts Early October Rally Amid $4,200 Retest
As the crypto market recovers from the end-of-September correction, Ethereum (ETH) is attempting to reclaim the crucial $4,200 area. Some analysts affirmed that the altcoin’s bounce signals that a new leg up could be coming in the next few weeks.
Ethereum Reclaims $4,000
On Monday, Ethereum continued to recover from the recent market pullback, surging nearly 6% from Sunday’s Lows toward a crucial barrier. Last week, the King of Altcoins recorded a sharp drop below the $4,000 level for the first time since early August, recording an eight-week low of $3,815 on Thursday afternoon.
Over the weekend, the cryptocurrency reclaimed the $4,000 barrier before surging to the crucial $4,100 mark on Sunday afternoon. This level served as a strong resistance throughout the past two years, as it represents the cycle’s previous high and a key bounce area during the Q3 rally. It also marks the lower boundary of its local $4,100-$4,800 range.
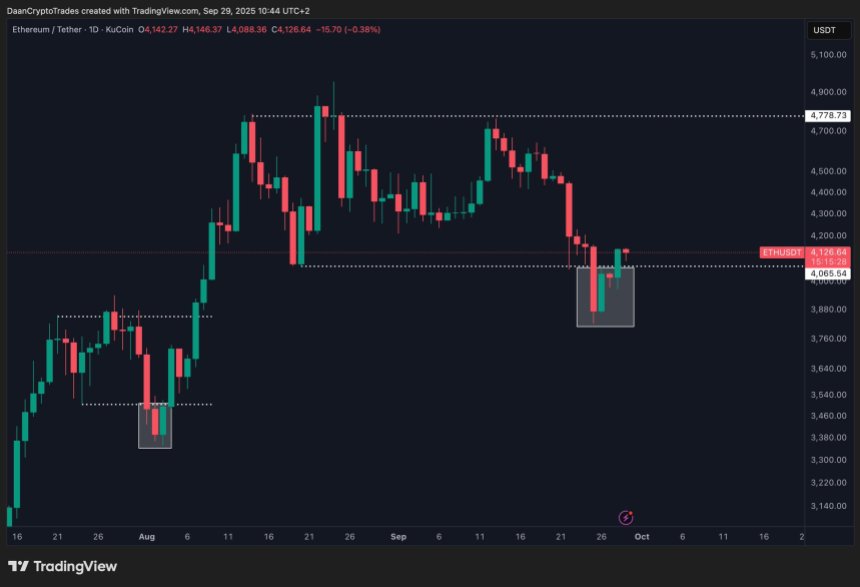
Market Watcher Daan Crypto Trades noted that the weekly candle on ETH’s chart closed above this level after “a solid effort by the bulls and a late Sunday push.” He added that it remains important to hold this area on the higher timeframes to target the range highs.
In the daily timeframe, the trader considers Ethereum has “not the worst look” as the recent reclaim shows a clear invalidation of the range breakdown and a potential recovery continuation. Daan also suggested that the cryptocurrency could be “taking one out of BTC’s playbook,” and be preparing for a massive new leg up following the range consolidation and deviation.
Similarly, Bluntz affirmed that ETH’s wave 4 on the daily timeframe “looks like it’s over with a leg higher into ath yet to come.” However, the analyst considers that the next all-time high (ATH) breakout won’t be as “sensational” as many believe, suggesting the $5,500 area as the main target.
ETH’s Next Leg Up Two Weeks Away?
Multiple market watchers highlighted a potential Power of Three (Po3) setup on Ethereum’s chart, signaling that the recent pullback was part of the second stage, manipulation, and the cryptocurrency is ready for the third phase, expansion.
Meanwhile, Merlijn the Trader affirmed that Ethereum is displaying a similar setup that preceded the May and July rallies. At the time, ETH broke down from its local range during a liquidity grab, sending the Relative Strength Index (RSI) indicator to oversold territory.
“This is the exact setup that birthed every violent reversal. Strong hands know it. Weak hands fold,” the trader affirmed. Additionally, he noted that the cryptocurrency could be repeating the late Q2 script’s timeline.
Per the post, Ethereum saw a 66-day consolidation between the May breakout and the next pump in July. During this period, the second-largest cryptocurrency saw a price fakeout below the range around the 45-day mark before breaking out 20 days later.
Last week’s correction below the local range occurred 46 days into the accumulation period, suggesting that a new breakout and leg up could come in the first half of October. “We’re at day 51. The longer the squeeze… The harder the detonation,” Merlijn stated.
Nonetheless, analyst Ted Pillows added that for more upside, ETH must recover the $4,250 area, where a strong sell wall is located, until the $4,320 level. If it fails to reclaim this area, the cryptocurrency risks retesting he $3,600-$3,800 support once again.
As of this writing, Ethereum is trading at $4,172, a 3.5% increase in the daily timeframe.

추천 콘텐츠

Ex-Alipay UK Chief Eva Zhang to Lead Blockscout Into AI-Driven Growth

Tokyo’s Metaplanet Launches Miami Subsidiary to Amplify Bitcoin Income
