

Bitcoin Falls as Stocks Rally, But Altcoins Show Surprising Strength
Bitcoin failed to join this week’s risk-on rally, which pushed major stock indices higher, dropping 2.57% over the last seven days, while the Russell 2000 surged 4.6% and the Nasdaq and S&P 500 posted gains.
Crypto market maker Wintermute noted that altcoins bucked this trend with selective rotation into XRP, SOL, and mid-cap tokens.
Gold and Treasuries gained ground as the dollar softened, while Brent crude futures firmed on geopolitical supply concerns.
However, crypto lagged dramatically, with BTC down 1.94% and ETH falling 3.39%.
Only altcoins like SOL, TRON, and Monero posted gains above 2%, leaving Bitcoin at the bottom of the performance table alongside traditional risk assets that thrived.
BTC Locked in Extreme Compression as $89–90k Support Holds
According to macro details shared by Jasper De Maere, a Wintermute OTC trader, he explained that Bitcoin rallied from the high-$80,000 range early in the week, briefly touching $94,700 before sellers emerged.
By midweek, the price had slipped below $90,000, printing a low around $89,200 before stabilizing near $91,000.
ETH mirrored this pattern, climbing toward $3,220 early before retreating to $3,080 by week’s end.
Wintermute highlighted that “$89–90k is support, $94–95k is resistance,” describing this narrow trading range as worthy of close attention given its duration.
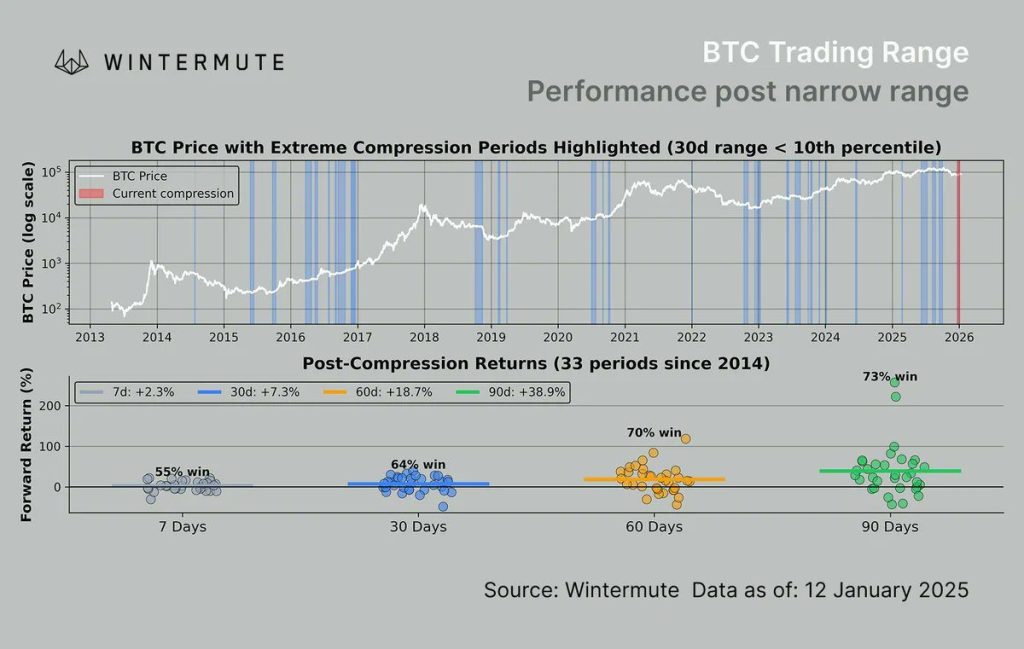
Since late November, BTC has remained trapped between the high-$80,000s and low-$90,000s, and that compression has reached extreme levels.
 Source: Wintermute
The 30-day trading range now sits at the 91st percentile, meaning price action has rarely been this narrow.
These periods typically mark consolidation phases where ownership turnover slows, and volatility collapses, though historical data shows BTC has posted positive returns 90 days out in three of four similar compressions.
ETF Outflows Erase Early Gains While Altcoin Products Attract Capital
ETF flows swung dramatically last week, starting with $471 million in inflows on January 2, followed by $697 million on January 5, the strongest single-day print since October.
Then came a sharp reversal with approximately $250 million exiting on Tuesday, $485 million on Wednesday, and $400 million on Thursday.
Over $1.1 billion left Bitcoin ETFs, erasing early gains almost dollar-for-dollar, while ETH products bled around $260 million alongside.
Jasper told investors the outflows “didn’t feel like distribution though,” noting there was no panic and volumes stayed healthy as fast money simply booked profits and stepped aside.
Meanwhile, altcoins caught a selective bid as XRP, SOL, and DOGE ETFs pulled in approximately $100 million combined while majors faced redemptions.
Wintermute cautioned that while some alt performance emerged, it felt “selective and concentrated in names with ETF flows or their own catalysts,” with consensus still holding that “BTC needs to lead before risk moves down the curve.”
On-Chain Data Shows Patient Market
Wednesday’s CPI print, expected at 2.7%, and Fed commentary on steadying interest rates are some of the catalysts that could see the market see some improvements this week.
Wintermute concluded that “this phase is more consolidation than distribution” as the U.S. Senate Banking Committee prepares to mark up the CLARITY Act on January 15.
While prices remain relatively stable, on-chain data from XWIN Research Japan already suggests a shift in market behavior as Bitcoin flows into exchanges have remained limited ahead of the bill discussions.
This shows that “market participants are not treating the legislative process as an immediate risk event requiring de-risking.”
SOPR (Spent Output Profit Ratio), which measures whether moved coins are sold at a profit or loss, is hovering around or slightly below 1.
 Source: CryptoQuant
This means that profit-taking is subdued and on-chain spending itself is low; Bitcoin simply is not being moved.
Together, these indicators point to a market that is not defensive but patient, with investors appearing to hold Bitcoin while waiting for regulatory clarity.
추천 콘텐츠

WLFI Bank Charter Faces Urgent Halt as Warren Exposes Trump’s Alarming Conflict of Interest

UNI Price Prediction: Targets $5.85-$6.29 by Late January 2026
