

Bitcoin price trades in bear flag range, directional risk builds
Bitcoin price is consolidating beneath $94,500 in a bear flag structure, with sellers maintaining control and downside risk growing as price remains capped below key resistance.
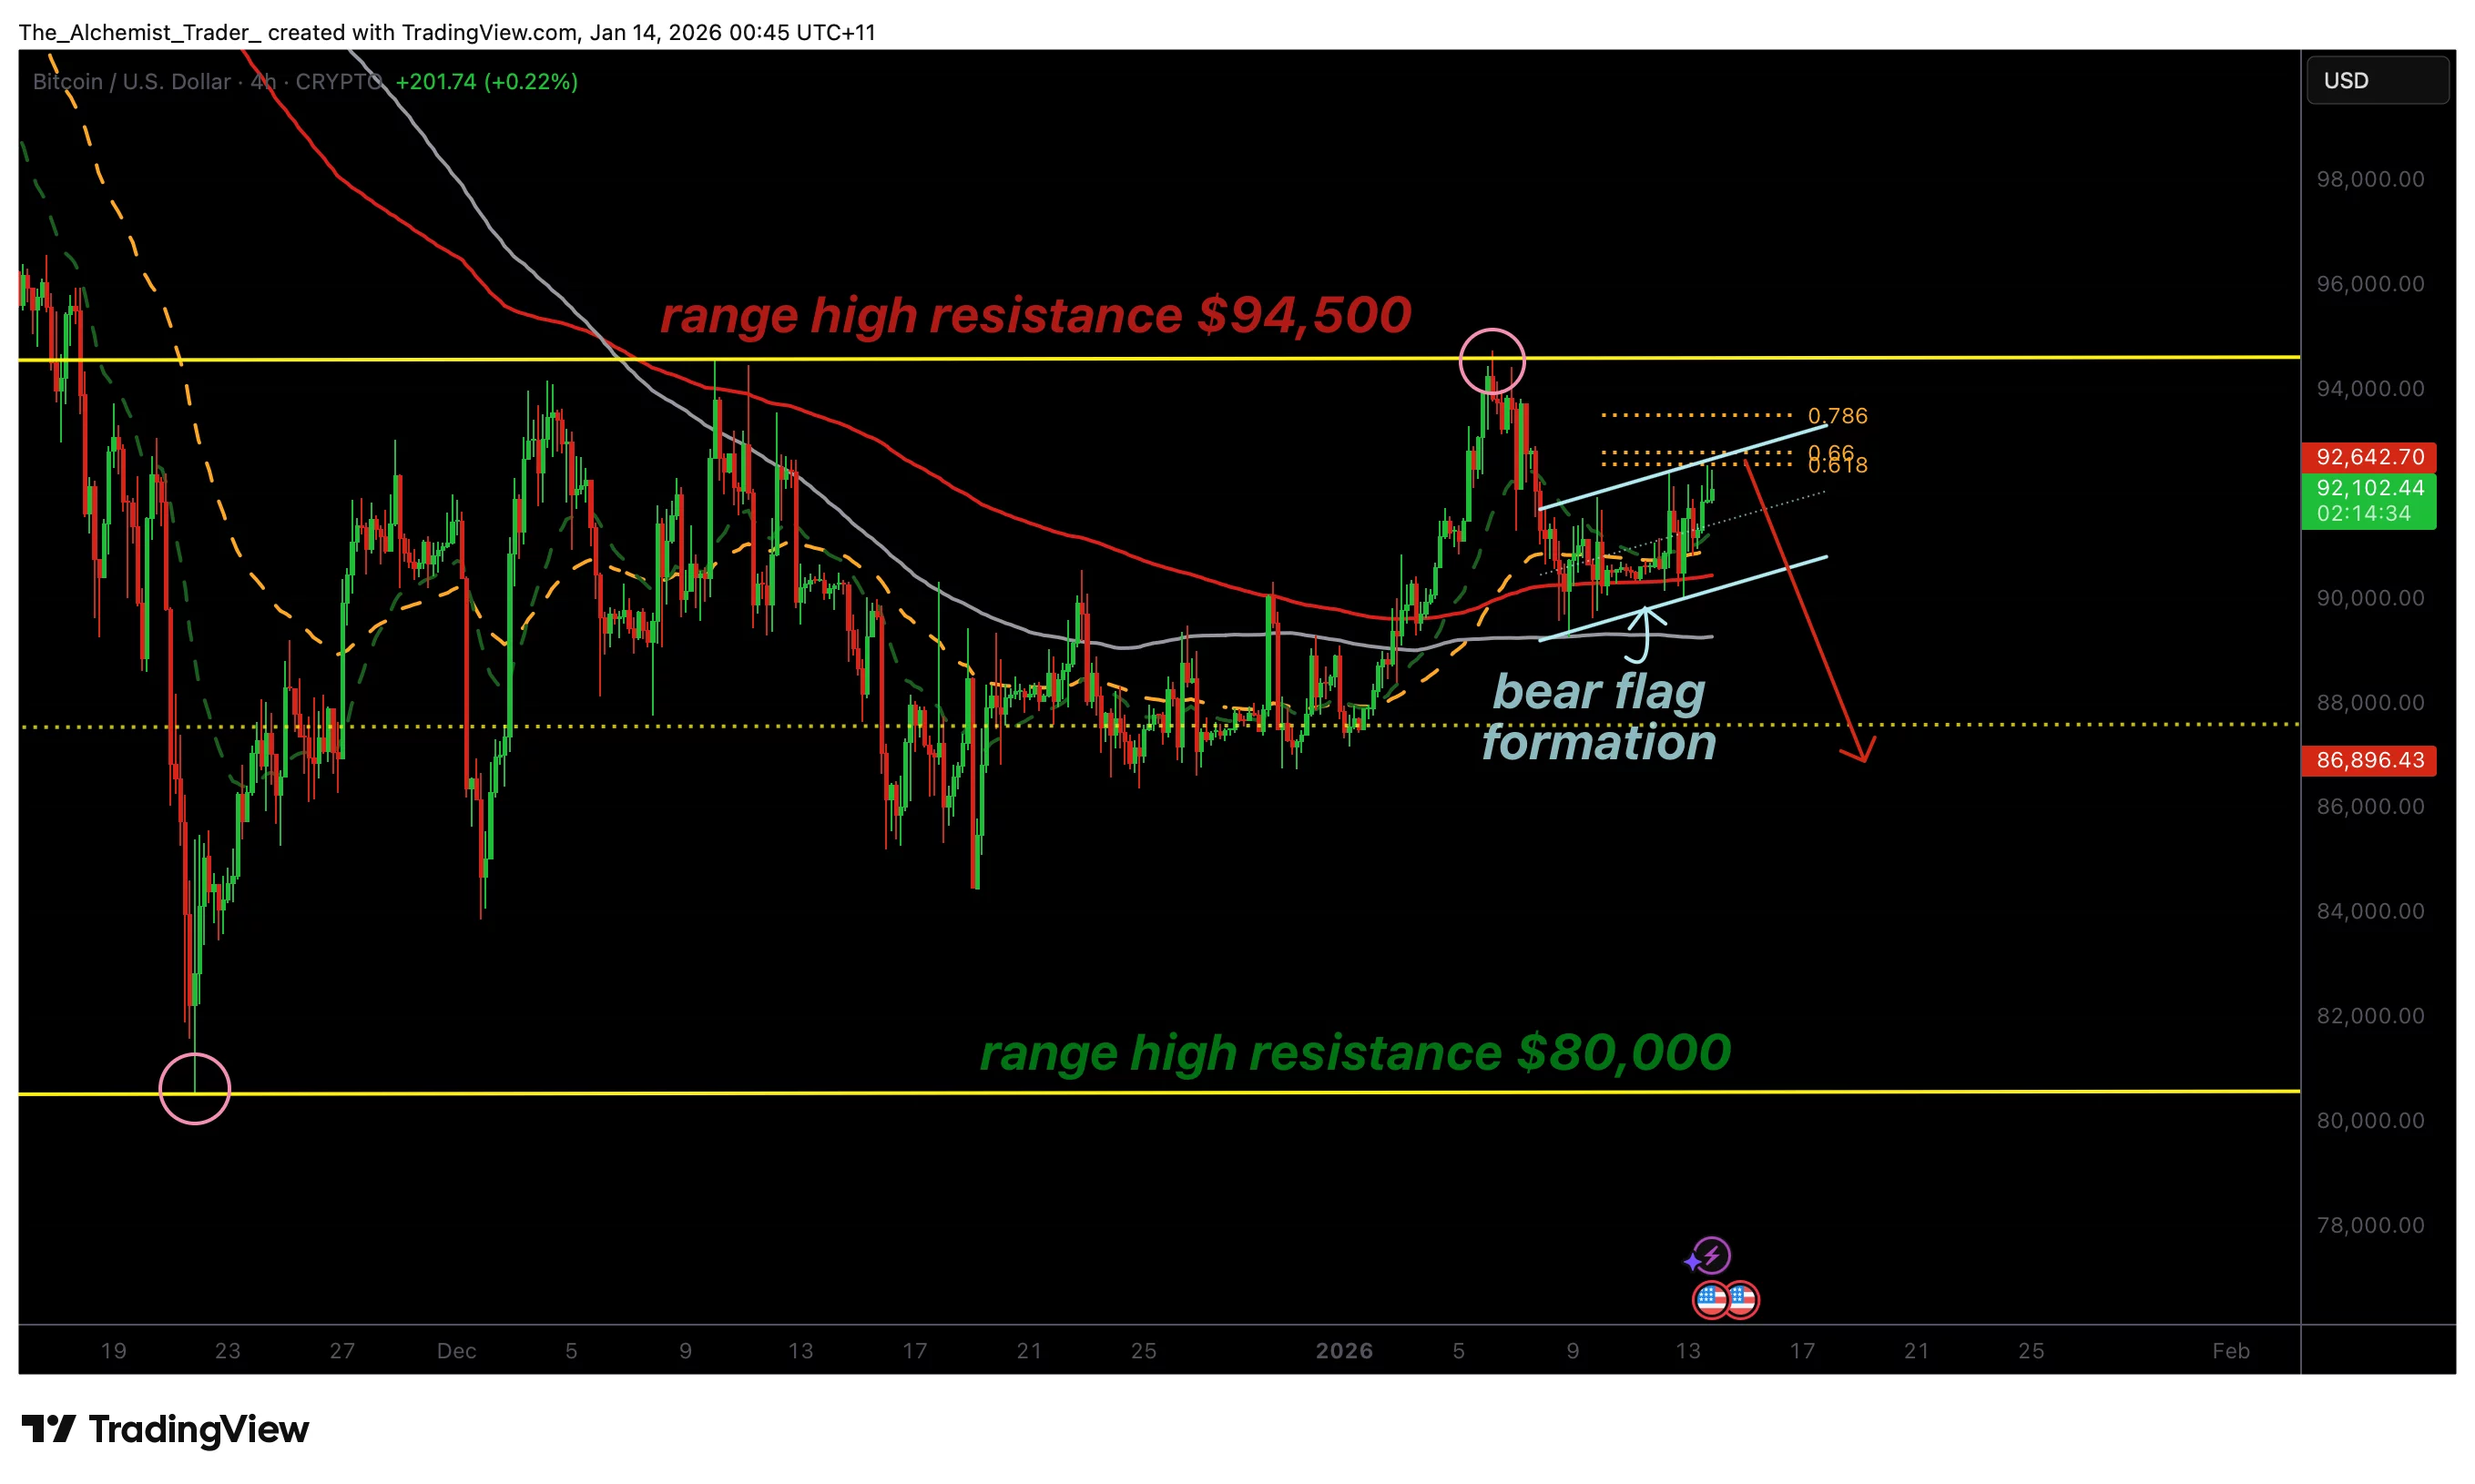
- BTC rejected from $94,500 range-high resistance, reinforcing supply
- Consolidation below the 0.618 Fibonacci forms a bear flag structure
- Breakdown risk favors rotation toward $80,000 range-low support
Bitcoin’s (BTC) current price action indicates early warning signals as the market consolidates in a pattern resembling a classic bear flag formation. After sharply rejecting the $94,500 range-high resistance, BTC has entered a tighter consolidation phase, in which the price is compressing beneath the resistance rather than reclaiming it.
This structure is important because bear flags often develop after strong downside moves and can act as continuation patterns when buyers fail to regain momentum.
Bitcoin price key technical points
- Bitcoin rejected from the $94,500 range-high resistance, reinforcing supply
- Price is consolidating beneath the 0.618 Fibonacci, forming a bear flag
- Bear flag continuation favors a rotation toward $80,000 range-low support
A bear flag typically forms when a market experiences a strong rejection or sell-off followed by a slow, controlled consolidation. This consolidation often slopes upward or moves sideways, creating the appearance of stabilization. However, the key concept behind the pattern is that the consolidation reflects temporary relief rather than real trend reversal.
In Bitcoin’s case, the market rejected sharply from $94,500, a level that has acted as high-time-frame resistance for the current trading range. This rejection pushed BTC lower and shifted momentum away from buyers. Since then, price has entered a consolidation phase beneath resistance, where rallies have struggled to gain traction.
The structure of this consolidation aligns with bear flag behavior: price is compressing beneath key resistance levels, with the market failing to reclaim higher ground on a closing basis. This signals that buyers are not showing enough conviction to reverse the move, and sellers may still be in control.
Resistance confluence: $94,500 and the 0.618 fibonacci
The most important technical barrier remains the $94,500 resistance zone, which marks the upper boundary of Bitcoin’s broader range. This level is reinforced by the 0.618 Fibonacci retracement, adding high confluence and strengthening the likelihood of rejection if price retests it.
In general, when Bitcoin trades below such confluence resistance and fails to reclaim it, the market often becomes vulnerable to rotational moves lower. This is because resistance zones attract selling interest and limit bullish continuation unless backed by strong volume and acceptance.
As long as BTC continues to trade below the 0.618 Fibonacci level and fails to close above $94,500, the bear flag structure remains active and downside risk remains elevated.
Volume as the breakout trigger
For Bitcoin to break out of the broader range, either upward or downward, the market will likely require a clear influx of volume. At present, Bitcoin’s price action reflects consolidation and hesitation rather than strong directional commitment.
A bearish breakdown from the bear flag would likely occur with expanding sell volume, signaling that sellers are regaining momentum. Conversely, if Bitcoin can reclaim $94,500 with impulsive strength and volume-backed acceptance, it would invalidate the bear flag structure and shift the short-term bias bullish.
Until that volume-driven breakout occurs, Bitcoin remains susceptible to continued range-bound movement, with bear-flag continuation remaining a higher-probability scenario as long as the resistance holds.
What to expect in the coming price action
In the near term, Bitcoin remains at a pivotal point where the bear flag structure could resolve in either direction. However, the technical bias remains cautious as long as BTC continues to trade below $94,500 and the 0.618 Fibonacci resistance.
A downside break would likely open a rotational move toward $80,000 range-low support, reinforcing the broader consolidation structure. A bullish invalidation would require Bitcoin to reclaim $94,500 on a closing basis, supported by strong volume and acceptance above resistance.
추천 콘텐츠

WLFI Bank Charter Faces Urgent Halt as Warren Exposes Trump’s Alarming Conflict of Interest

UNI Price Prediction: Targets $5.85-$6.29 by Late January 2026
