

Bitcoin’s August correction continues, but could this stealth catalyst spark a rally?
Bitcoin has slipped below $115,000 amid an August correction, but behind the surface, a quiet shift in macro conditions may be laying the groundwork for a sharp reversal.
At the time of writing, Bitcoin (BTC) is down 4% over the previous week, trading at $114,295. The pullback is a retracement of about 7% from its all-time high of $122,838 set on July 14. 10x Research points to a possible turning point that may be driven by less obvious macro shifts.
Labor market revisions may reshape Fed expectations
In its Aug. 4 report, 10x Research argues that Bitcoin’s recent price action aligns with typical August seasonality, but adds that something deeper is unfolding. Specifically, revised U.S. labor data points to a softer employment outlook than markets had priced in, potentially undermining the Fed’s “resilient economy” narrative.
This setup is very similar to Q3 of 2024, when the Fed unexpectedly lowered interest rates by 50 basis points in September in response to early indications of labor market weakness. Prior to that decision, markets had experienced a significant decline, but they later recovered after the policy change was confirmed.
Bitcoin may be preparing for a similar recovery if the Fed follows that pattern, one that is fueled more by a change in macro sentiment than by direct crypto catalysts.
According to 10x, the key variable to watch is not inflation or unemployment, but how the Fed interprets asset price corrections, particularly in equities, as signals of economic stress. That dynamic could again guide policy decisions ahead of the September FOMC meeting.
Bitcoin technical analysis
On the technical front, Bitcoin’s price remains under pressure, now sitting below the 20-day simple moving average of $117,239 and the upper Bollinger Band near $121,345. The Bollinger Bands have begun to narrow, indicating reduced volatility and a potential squeeze setup.
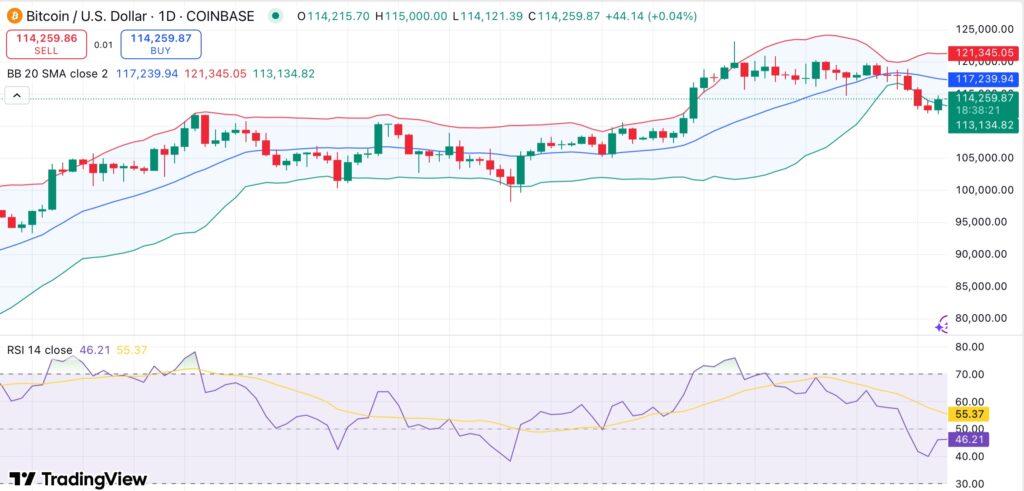
Relative strength index has cooled to 46.21, moving below its 14-day average of 55.37, which suggests neutral-to-bearish momentum. The near-term range is defined by $112,000 as support and $119,500 as resistance, with no clear breakout in either direction.
The price is consolidating just above the lower Bollinger Band at $113,134, a zone that could serve as a base if sentiment turns more positive. If the Fed confirms dovish policy in the coming weeks, this could serve as the macro catalyst needed to break above the $117K–$120K zone.
Until then, Bitcoin appears stuck in a sideways pattern, with downside risk still present but a rebound within reach if the narrative shifts.


추천 콘텐츠
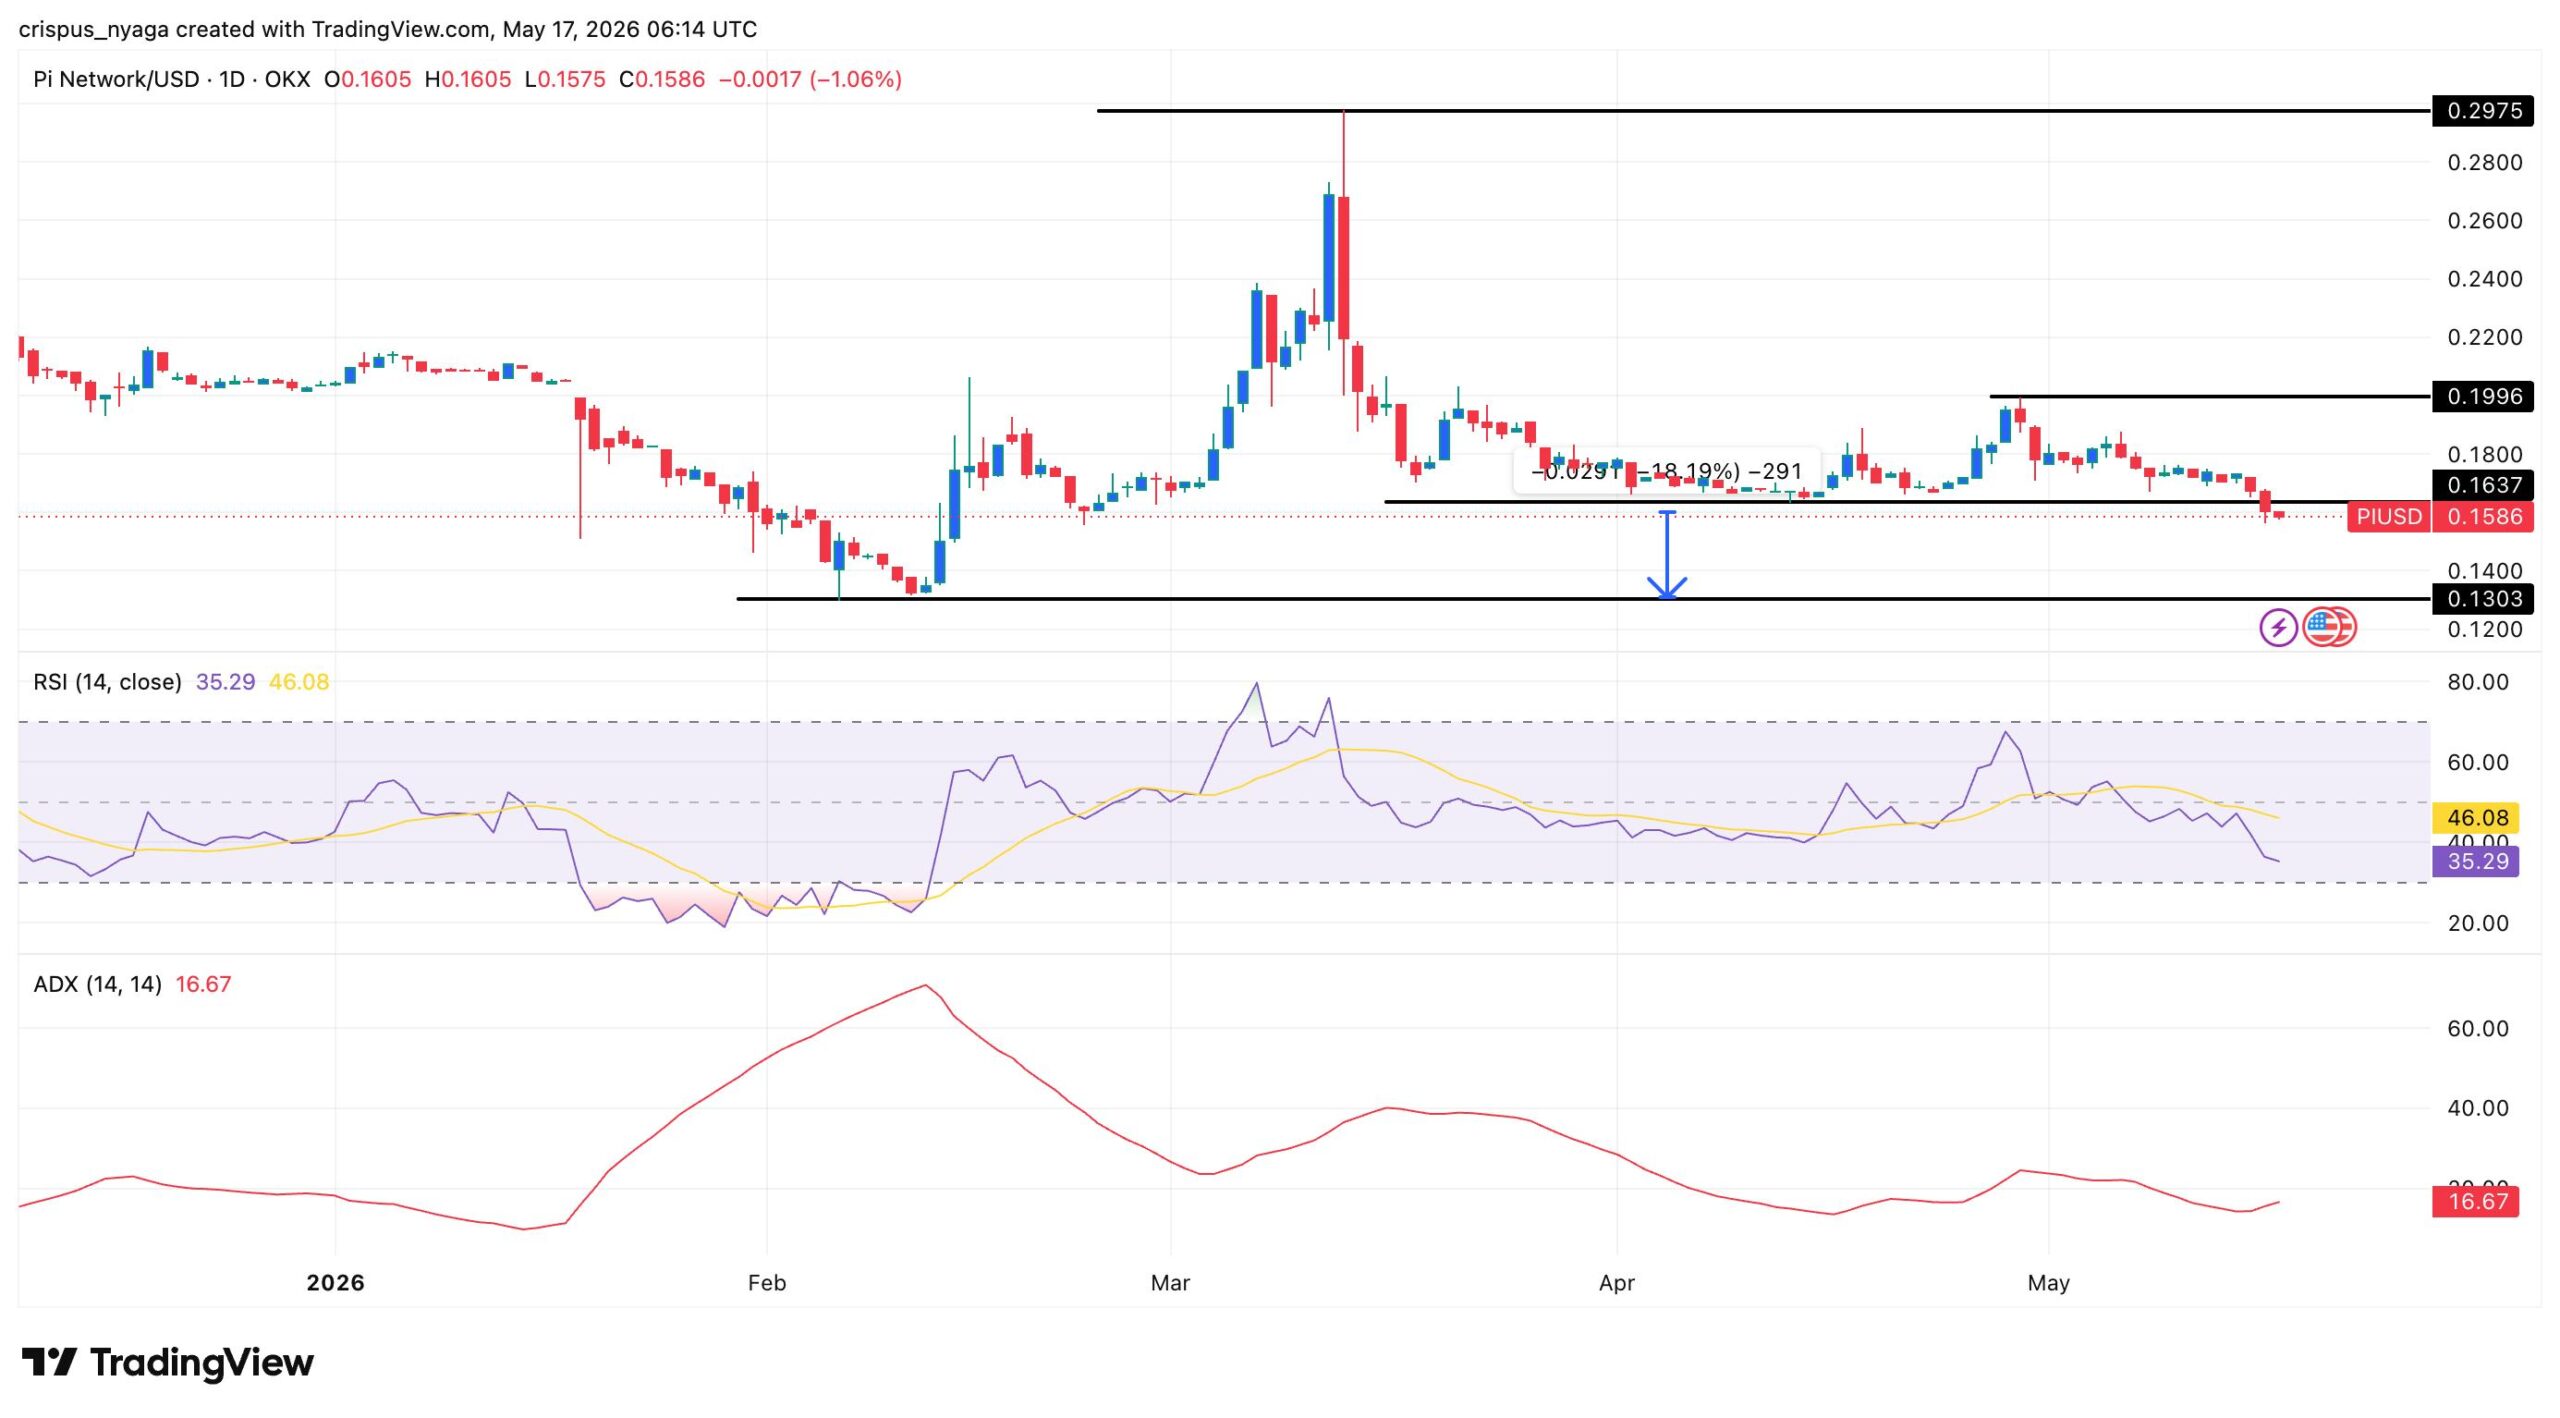
Pi Coin Price Crashes Another 7.5% Before Pi Network Protocol 23 Mainnet Activation

Evercore ISI S&P 500 Forecast 2026: Base Case 7,750, Bull Case 9,000


