

Ethena prints golden cross that preceded 87% rally in 2024
A golden cross has formed on the Ethena daily chart, and last time this appeared, ENA rallied over 80%.
- Ethena (ENA) rose 16% to $0.85 on Aug. 11, extending its 30-day gains to nearly 150%.
- USDe, Ethena’s synthetic stablecoin, has surpassed $10 billion in supply.
- Ethereum’s breakout above $4k has strengthened confidence in USDe’s ETH-backed reserves.
According to data from crypto.news, Ethena (ENA) rallied 16% to an intraday high of $0.85 on Monday, Aug. 11. At this price, its weekly gains stand at over 35% while its gains over the past 30 days stood at nearly 150%.
Its market cap has risen to $5.4 billion, while its daily trading volume has dipped slightly, as over $1.4 trillion of ENA exchanged hands between traders.
Why did ENA rally today?
ENA’s rally today could primarily be due to improved investor sentiment as USDe, its synthetic stablecoin, surpassed $10 billion in circulating supply, marking a major milestone for the project. Notably, this milestone was reached with just 500 days since the stablecoin was launched, making USDe one of the fastest-growing stablecoins in the crypto industry.
Besides strong growth in its stablecoin, ENA’s rally has also been drawing strength from investor euphoria over Ethereum (ETH) breaking past $4k, a psychological resistance level it has struggled to surpass since December last year.
Ethereum has rallied over 20% over the past 7 days, significantly outperforming Bitcoin, which was up less than 7% during the same time period.
Strong Ethereum rallies often bode well for popular Ethereum-based projects. Since Ethena’s collateral reserves and hedging strategies are heavily ETH-based, Ethereum’s strong performance over the past week has noticeably strengthened the valuation of the protocol’s reserve, which in turn reinforces confidence in USDe’s stability. As such, ENA often moves in tandem with Ethereum.
Another bull case seems to be the demand for ENA across Korean markets. Some community members have observed that Korean investors have been increasing their exposure to Ethena over the past weeks, as highlighted by X user Ponyo.
ENA price analysis
ENA broke out of a descending parallel channel in early July as investor demand picked up. Since then, it has climbed over 200% to $0.81 as of press time.
On the daily chart, the 50-day simple moving average has crossed above the 200-day simple moving average, forming a “golden cross.” This pattern often signals the start of a strong uptrend. The last time ENA formed a golden cross in late November, it gained more than 87% to reach its December peak of $1.33.
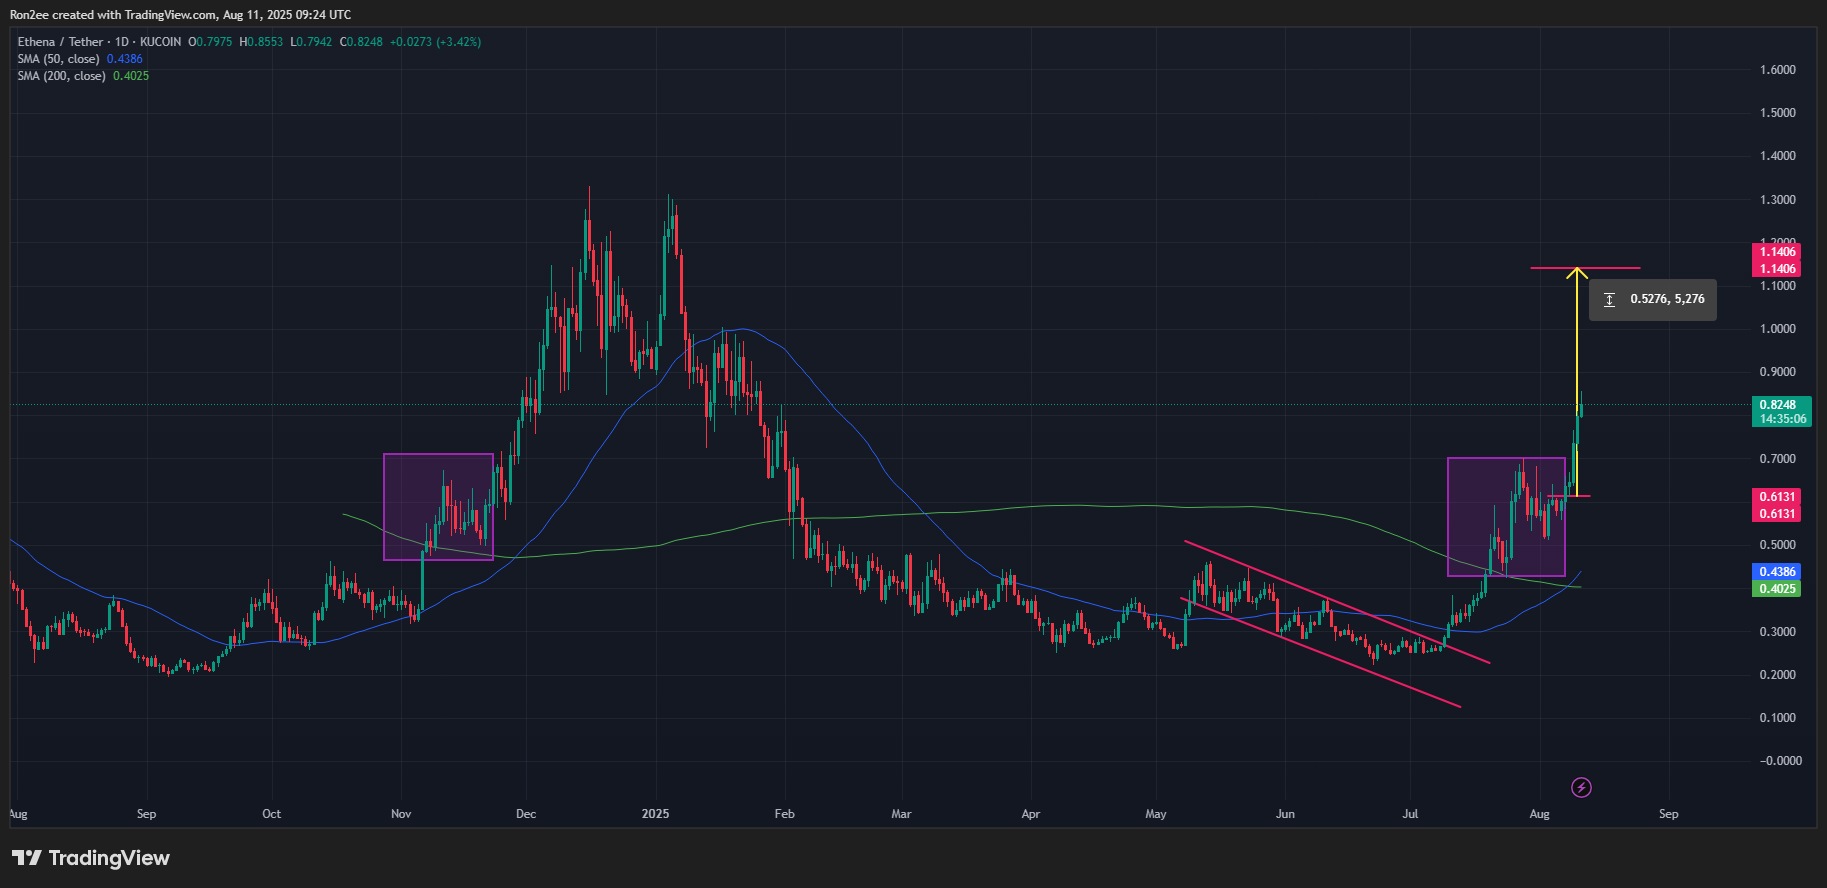
The current price structure also looks similar to that period, suggesting a possible recurrence of the earlier rally.
If ENA were to replicate the November rally in percentage terms, the projected target would be around $1.14.
Momentum indicators were also pointing higher at press time. The MACD line had moved above the signal line, a crossover often seen as confirmation of upward momentum, suggesting that buyers remain in control. The RSI is also in overbought territory after ENA’s sharp gains.
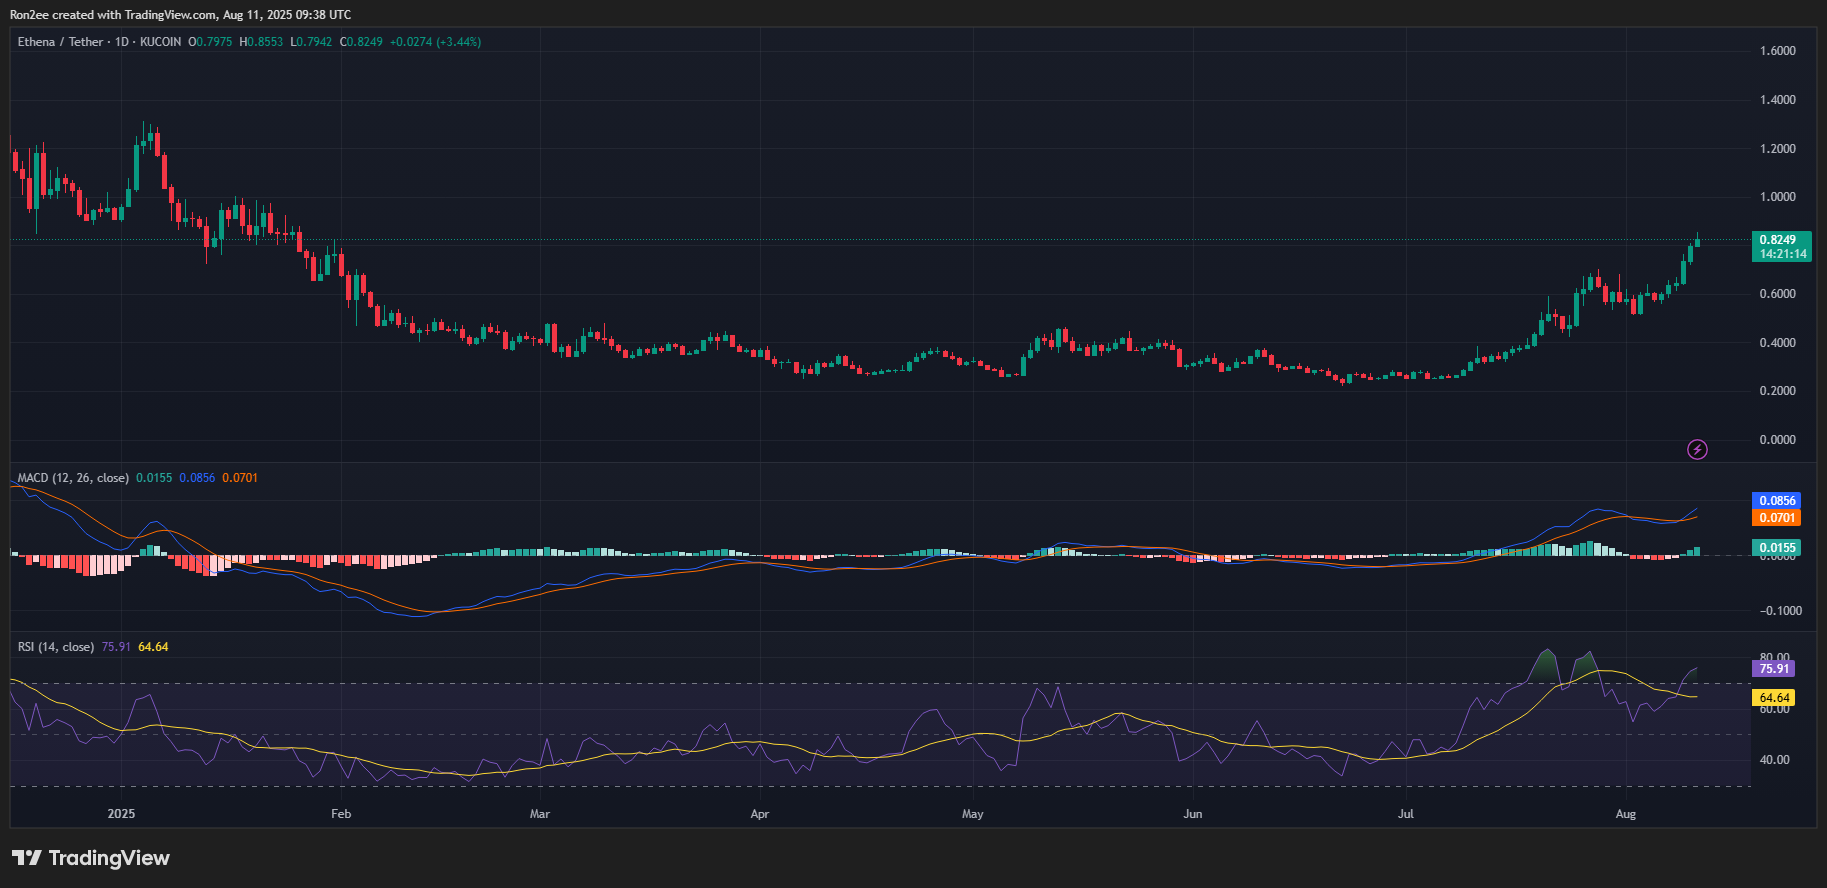
While this condition sometimes precedes short-term pullbacks, strong rallies backed by robust fundamentals can sustain overbought readings for an extended period. Nonetheless, minor corrections could occur before ENA’s next leg up.
Disclosure: This article does not represent investment advice. The content and materials featured on this page are for educational purposes only.


추천 콘텐츠

Justice Department has 'gone off the rails' for Trump's 'pretzel logic': analysis

EUR/GBP Exchange Rate Surges as Bank of England Rate Hike Expectations Intensify – Market Analysis


