

Here’s why Sui price is crashing despite Robinhood listing

Sui price continued its strong downward trend today, August 19, even after it was listed by Robinhood, one of the biggest players in the U.S. crypto industry.
- Sui price plunged by nearly 4% despite the Robinhood listing.
- The coin has formed a head-and-shoulders pattern on the eight-hour chart.
- The decline coincided with the ongoing crypto market crash.
Sui (SUI) token plunged for three straight days and reached its lowest level since August 7, and 21% below the highest point this year.
Sui price crashed as demand waned
The Sui token plunged after its Robinhood listing, which made it available to millions of American investors. In most cases, cryptocurrencies often surge after such a listing.
There are three possible reasons why Sui price crashed. First, the decline mirrored that of other cryptocurrencies. Bitcoin (BTC) plunged to $113,000, while the market capitalization of all tokens fell to $3.83 trillion, down from over $4.1 trillion last week.
Second, third-party data shows that Sui demand is falling. CoinMarketCap data shows that the 24-hour volume dropped by 10% to $1.33 billion. Similarly, the futures open interest dropped to $1.84 billion, down from $1.9 billion on Monday.
Investors have also continued moving their tokens from their staking pools. StakingRewards data shows a 27 million decline in staked Sui, worth $95 million over the last 30 days.
Third, Sui’s ecosystem is not doing well as the total value locked in its decentralized finance dropped by 4.15% in the last 30 days to $2.79 billion. Its stablecoin market cap has dropped by 12.8% in the last seven days to $767 million.
Sui crypto price technical
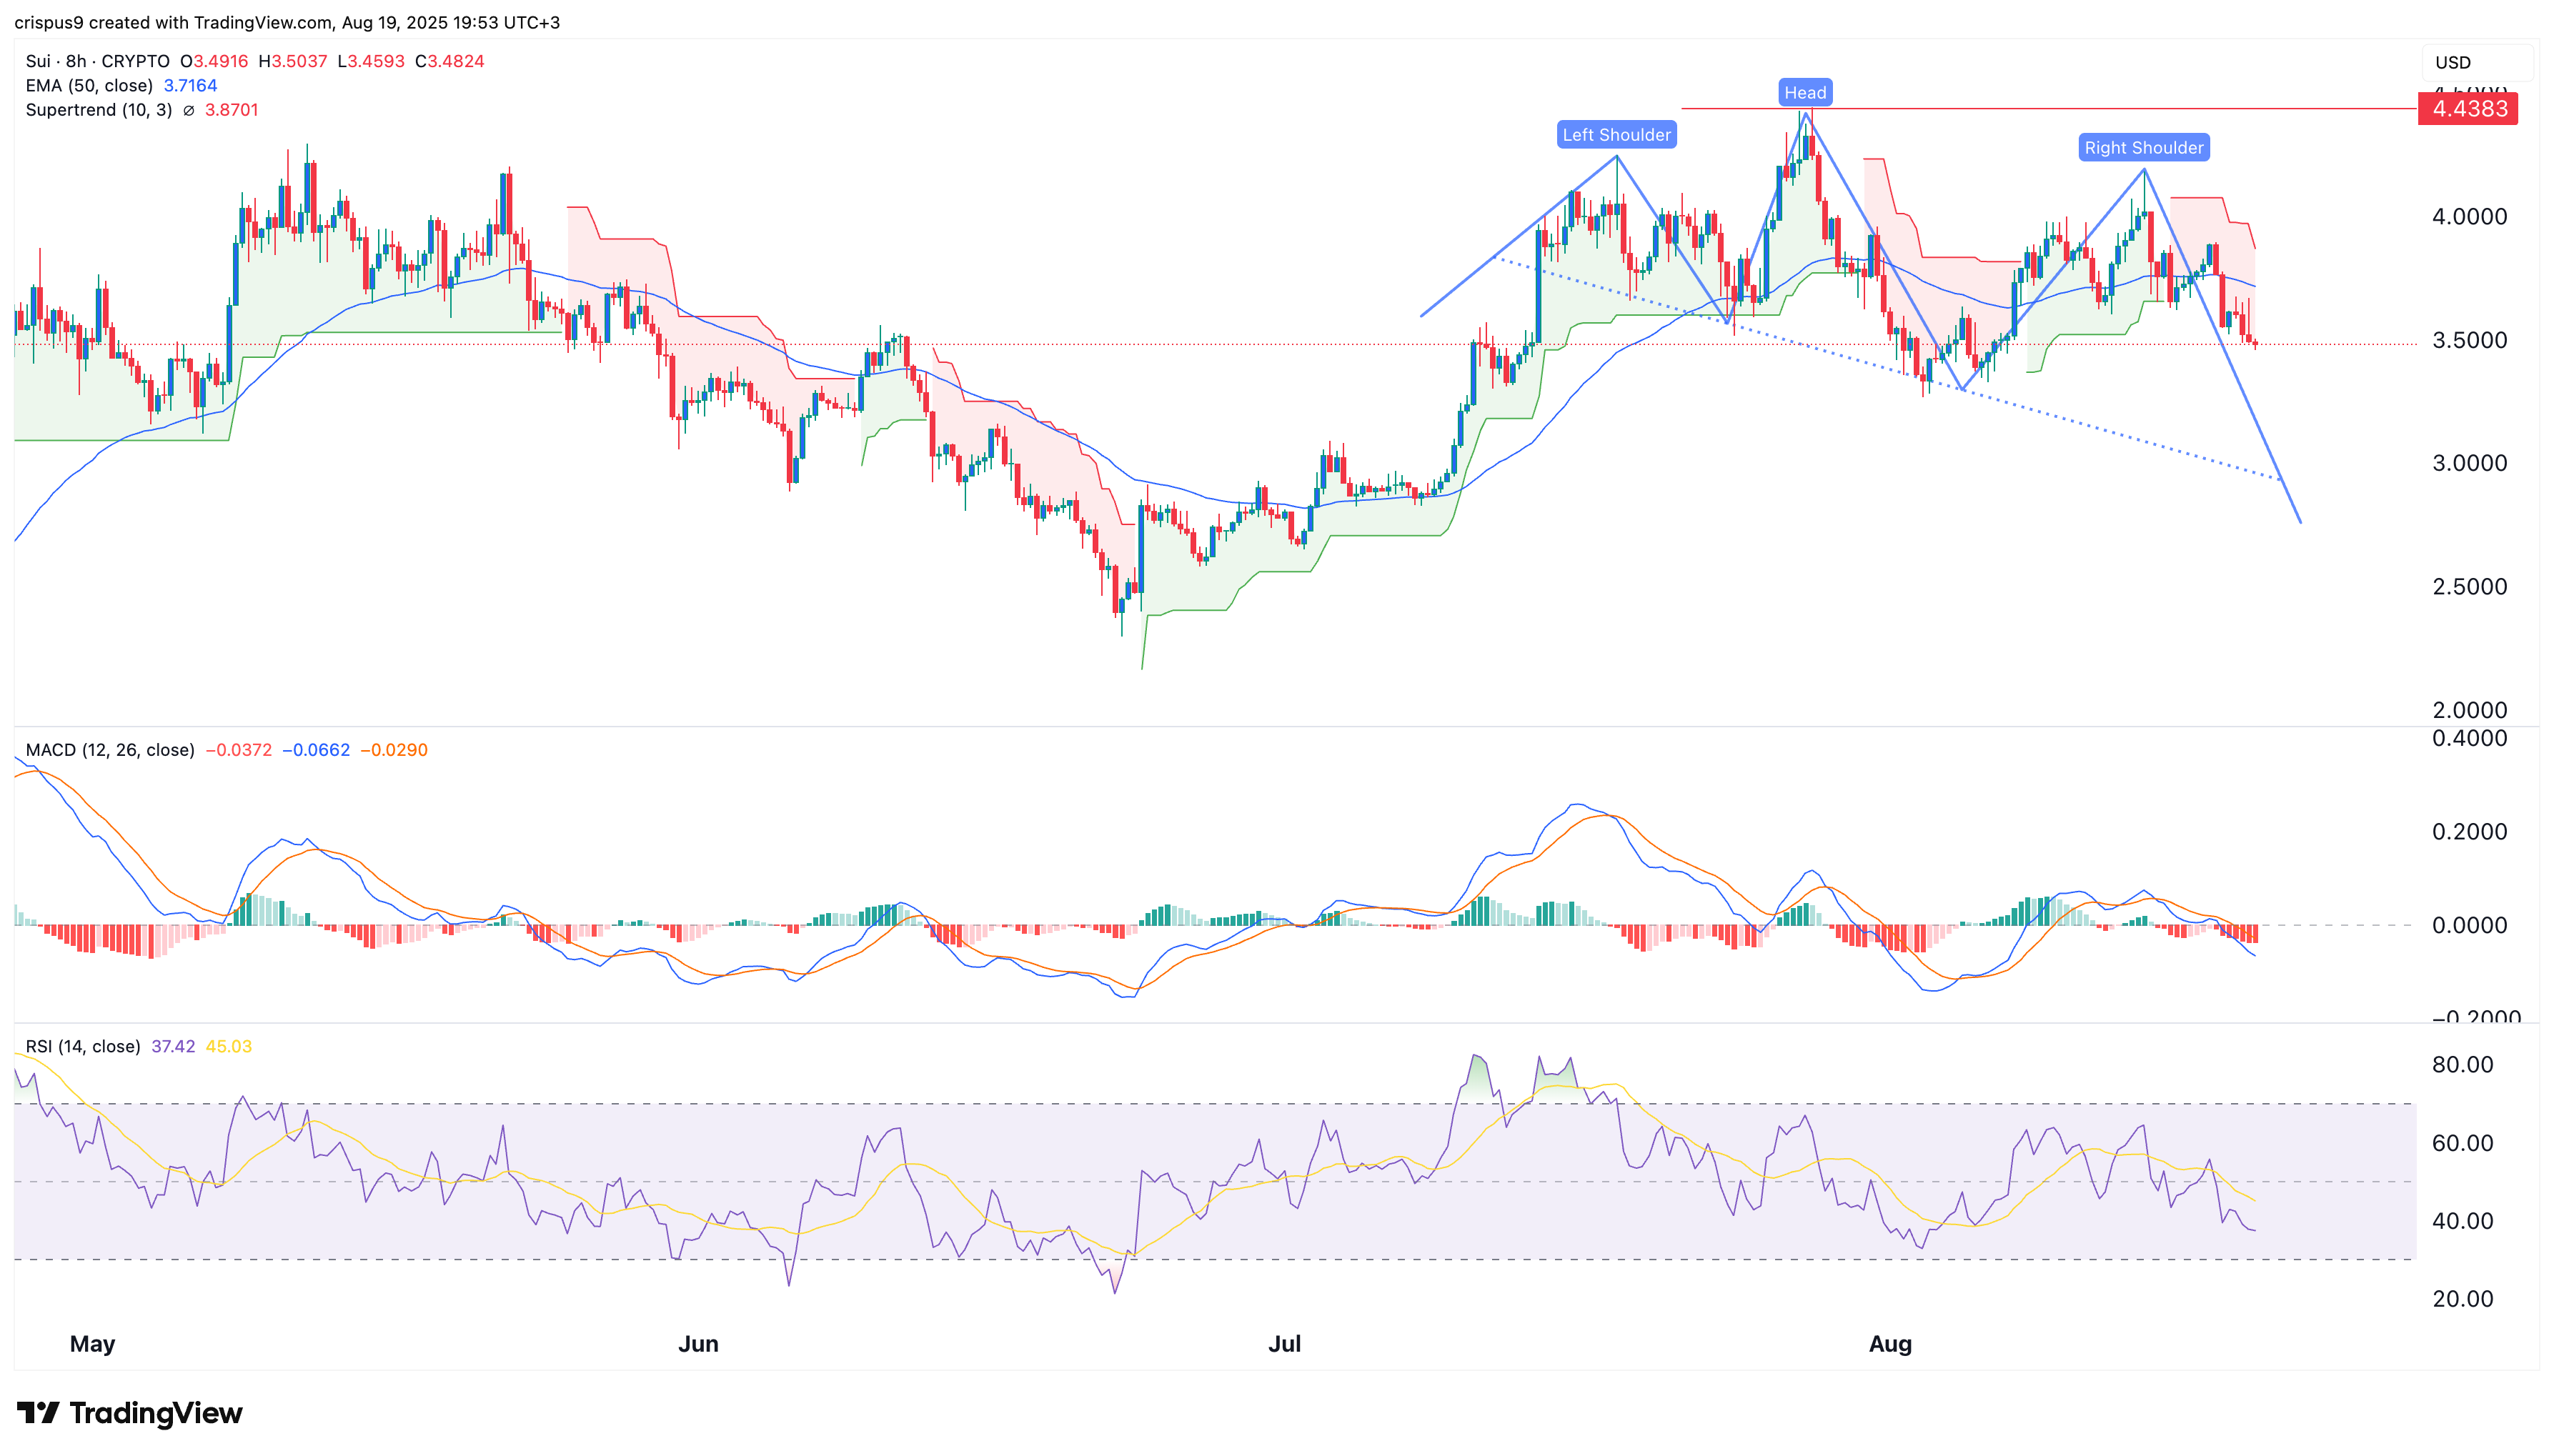
The eight-hour chart shows that the SUI price has been in a strong downward trend in the past few days as it moved from a high of $4.20 on August 13 to the current $3.46.
Sui crypto price has tumbled below the 50-period moving average at $3.20. It has also formed the highly bearish head-and-shoulders chart pattern. It has now plunged below the right shoulder section.
The Supertrend indicator has turned red, a sign that the bearish momentum is continuing. Also, the Relative Strength Index and the MACD indicator have both pointed downward.
Therefore, the Sui price may continue falling as sellers target the key resistance level at $3.2845, its lowest level on August 2. A break below that price will raise the odds of the coin dropping below $3.


추천 콘텐츠

Crypto’s wash trading problem is ‘far more common’ than investors think, DOJ sting shows

Phemex Publishes April 2026 Proof of Reserves, Reporting 131% Total Reserve Ratio


