

Ethereum Price Forecast: ETH plunges below $4,200 as investors brace for Powell's speech
- Ethereum investors are expecting increased volatility in the short term as Fed Chair Powell's speech at Jackson Hole approaches.
- A record high in validator queue exits and sustained ETH ETF outflows could also weigh on market sentiment.
- ETH tested the $4,100 support on Tuesday after its technical indicators hinted at a bearish outlook.
Ethereum extended its decline by 5% on Tuesday, breaching the $4,200 level following a rise in short-term volatility, validator queue exits and institutional outflows. The cautious sentiment shows traders continue to de-risk ahead of Federal Reserve (Fed) Chair Jerome Powell's speech at the Jackson Hole Economic Symposium on Friday.
Ethereum investors brace for volatility as Powell's speech draws closer
Ethereum dropped below $4,200 on Tuesday, stretching its decline to over 10% since the US Producer Price Index (PPI) inflation data for July rocked the market last Thursday. During the period, Ethereum has seen long liquidations of over $1.1 billion, per CryptoQuant's data, a demonstration of de-risking ahead of Powell's speech on Friday.
"Traders are bracing for a volatile end to August, with all eyes on Jackson Hole," noted Nick Forster, founder of crypto options platform Derive, in a Tuesday note.
He highlighted that near-term (7-day) ETH implied volatility (IV) on Derive rose from 68% to 73% on Monday, while that of the 30-day IV remains fairly muted. "[It's a] sign that markets expect heightened volatility in the immediate term," Forster added.
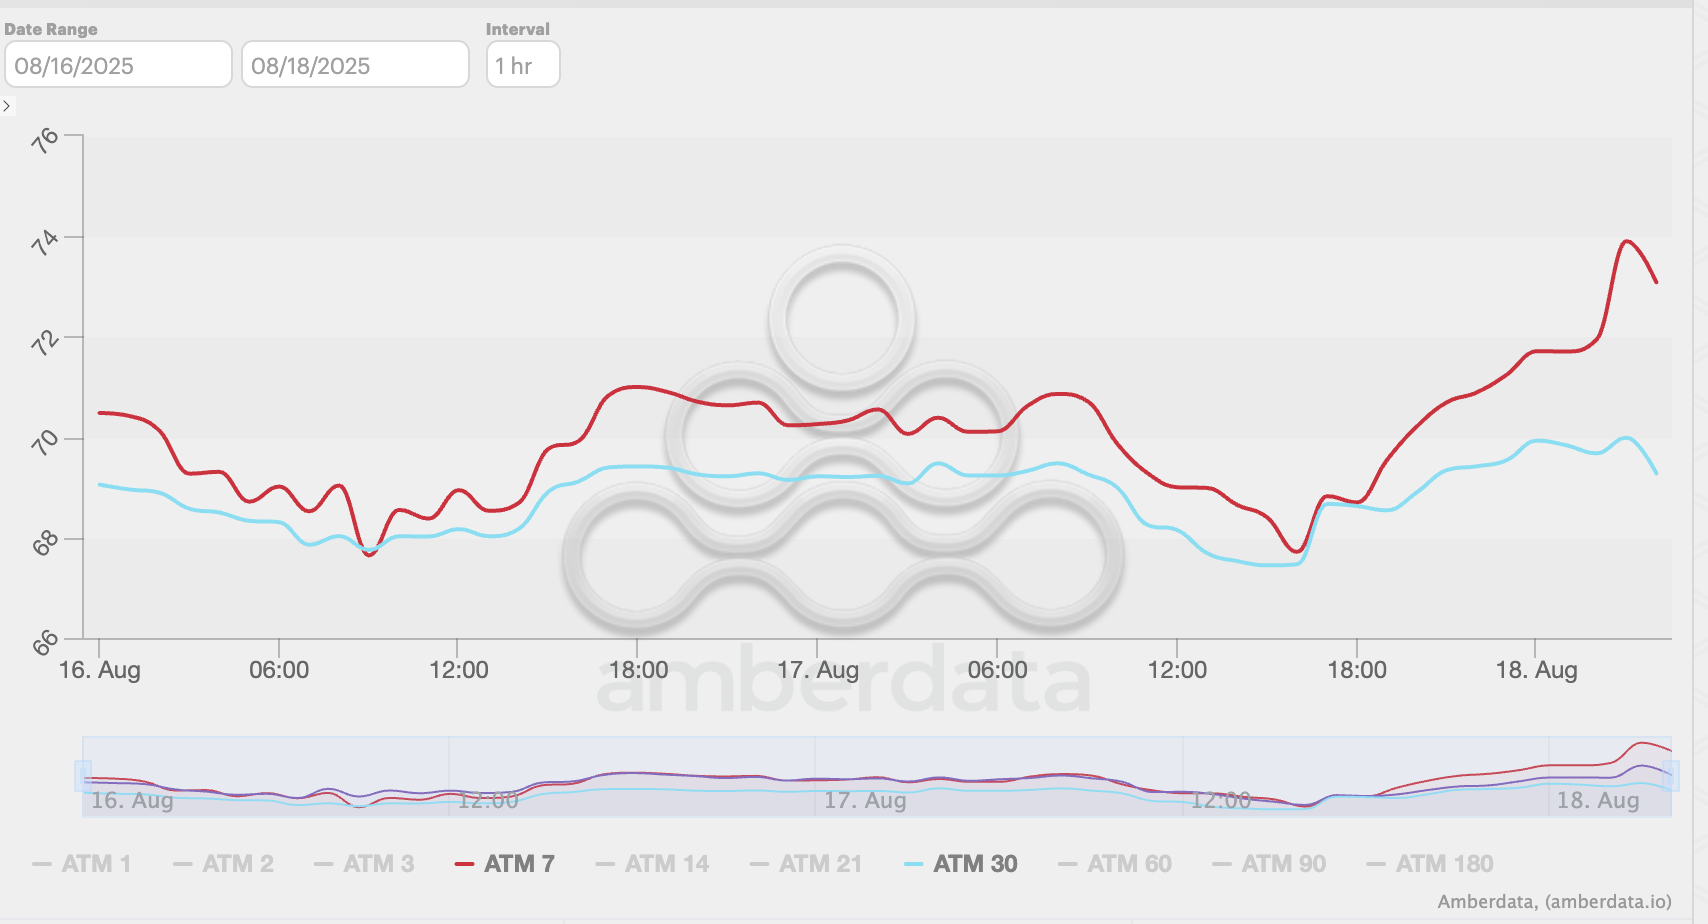
ETH 7-day IV (Red) vs 30-day IV (Blue). Source: Derive, Amberdata
The higher-than-expected inflation data last week sent market participants' expectations of a rate cut at the next Federal Open Market Committee (FOMC) meeting in September plunging below 90% and falling to 82% on Tuesday, according to the CME FedWatch Tool. While investors still lean toward a rate cut, the drop signifies cautious sentiment is gradually setting in.
"If Powell signals a continued hawkish stance, we could see a rapid correction in digital assets, particularly for BTC and ETH," said Forster. On the other hand, a dovish stance could lift the market. The probability of ETH declining to $4,000 by the end of September has spiked from 45% to 60% on Derive, he added.
A similar sentiment is evident on-chain, where Ethereum's validator exit queue has surged to a record high of 927,000 ETH, per data from Validatorqueue.com. Validator exit queue shows the number of coins waiting to leave transaction validation responsibilities. While some of these coins may not go toward profit-taking, high exits during a price correction often negatively affect market sentiment.
Meanwhile, US spot Ethereum exchange-traded funds (ETFs) registered net outflows of $196.6 million on Monday — its second largest since launching last July, per SoSoValue data.
Ethereum Price Forecast: ETH technical indicators on verge of flipping bearish
Ethereum is testing the $4,100 support after declining below the 14-day Exponential Moving Average (EMA), marking a sharp turnaround from its uptrend over a week ago.
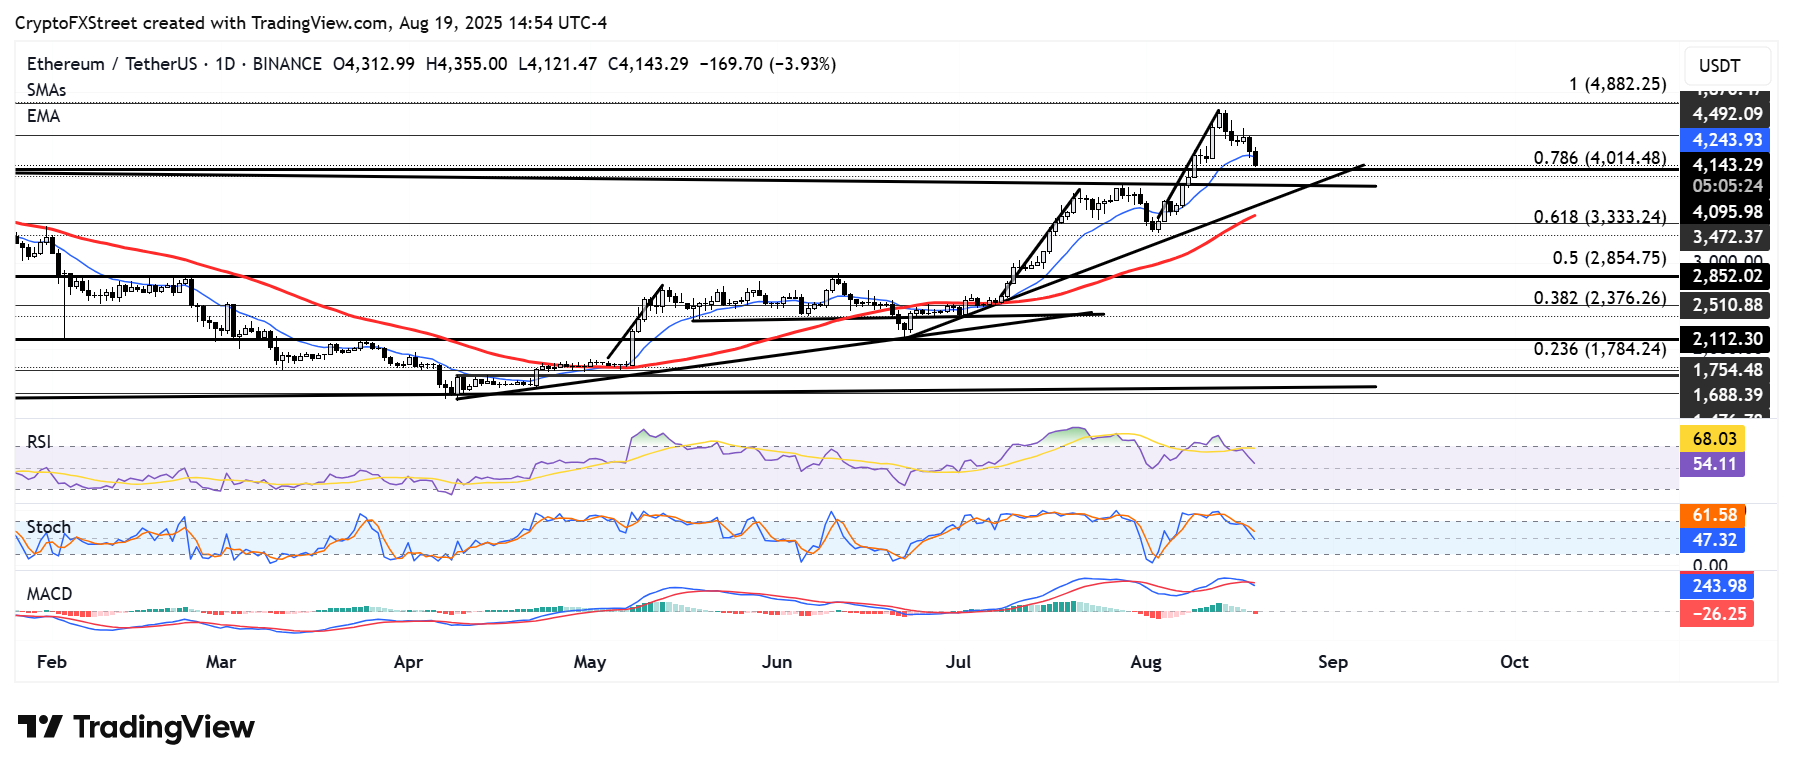
ETH/USDT daily chart
If ETH declines below $4,100, it could find support at the 78.6% Fibonacci Retracement level near $4,000, just above a key descending trendline. A failure to hold the $4,000 psychological level and the descending trendline could send ETH toward $3,500.
However, a bounce off these support levels could see ETH tackle the $4,500 resistance.
The Relative Strength Index (RSI) and Stochastic Oscillator (Stoch) are on the verge of declining below their neutral levels, a move that could accelerate bearish momentum. The Moving Average Convergence Divergence (MACD) also highlights a potential trend shift toward the bearish side, after crossing below its signal line, with its histogram bars flipping to red.
A daily candlestick above $4,500 will invalidate the bearish outlook and potentially send ETH to test its all-time high resistance at $4,868.


추천 콘텐츠

Meta (META) Stock; Dips Despite Expansion of Ray-Ban and Oakley Smart Glasses in Korea
ECHO Token Crashes Double Digits After Massive Echo Protocol Exploit


