

Here Are Bitcoin’s Biggest Support Levels Ahead: Will BTC Drop to $70K?
TL;DR
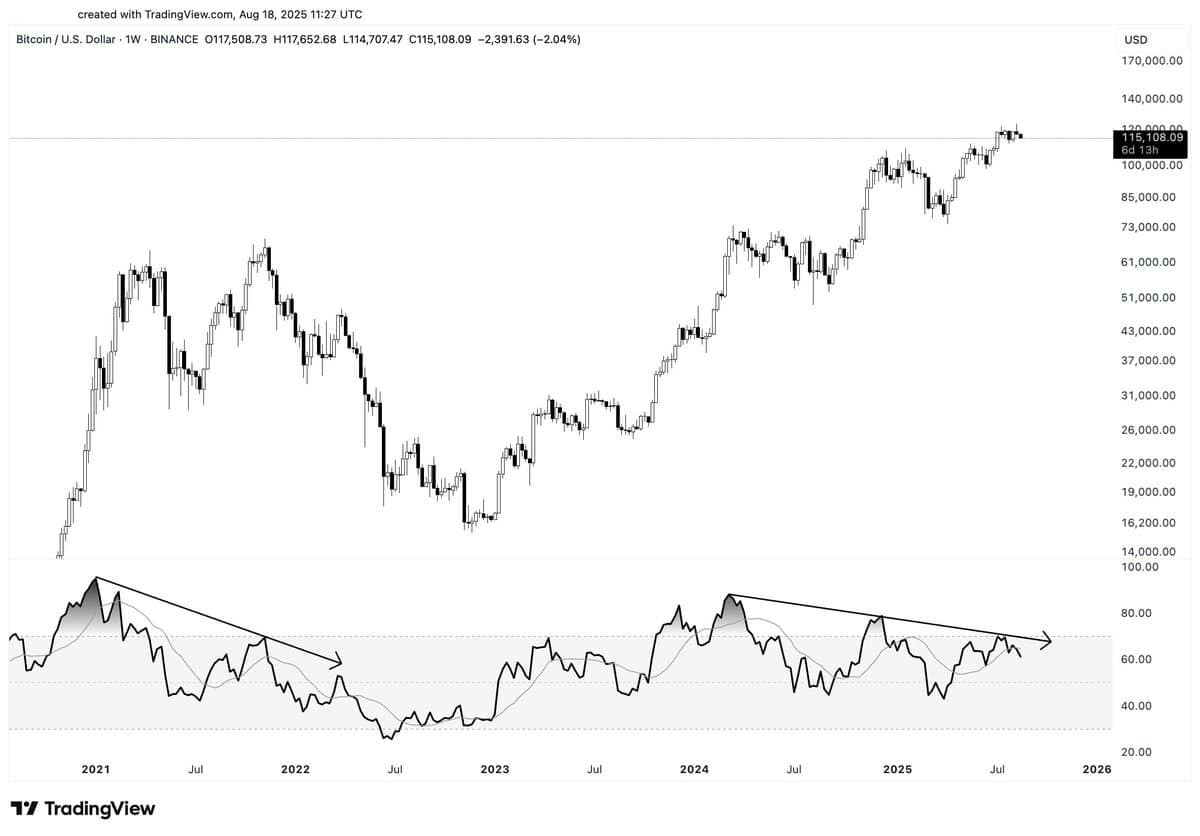
- Bitcoin’s RSI shows weakening momentum despite previous price gains, raising concerns about trend strength.
- MVRV model outlines critical support at $112K, $91K, and $70K amid recent pullback.
- First-time buyers added 50K BTC during the dip, suggesting quiet accumulation despite bearish signals.
Bitcoin Price and Market Movement
Bitcoin was trading below $114,000 at press time, down 5% over the past week. After reaching a 24-hour peak of $117,000, the price has pulled back slightly as the market enters a period of consolidation.
Crypto analyst Ali Martinez shared an update on Bitcoin’s support levels based on MVRV Pricing Bands, which measure how far the current price deviates from the average cost basis of holders.
Based on this model, the next major support levels are at $112,800, $91,400, and $70,000. These are levels where Bitcoin has historically found strong demand during corrections.
At the time of analysis, Bitcoin was trading between the +0.5σ band ($112,830) and the +1.0σ band ($134,250). This range is often seen during elevated but stable conditions in the market.
RSI Divergence and Trend Shift Signs
On the technical side, Martinez noted a pattern forming on the weekly RSI. While the price has continued to rise, the RSI has been making lower highs since March 2024. This is known as a divergence and often appears when buying strength does not match price gains.
In a post on X, Ali wrote,
This suggests momentum may be fading, even if the price is near recent highs.
 Source: X
Another market watcher, Captain Faibik, pointed to a rising wedge breakdown and added that the daily candle closed below the EMA50, which is near $114,900. He stated that “Bitcoin is now very close to the $111,880 support level. If bulls fail to defend it, the next target will likely be around 108k.”
He also added that holding above $112,000 could allow for a possible recovery and retest of the moving average. The current setup suggests that sellers are still in control, unless a bounce occurs soon.
Buyer Activity and Accumulation
As CryptoPotato reported, over the last five days, wallets tagged as “First Buyers” have added roughly 50,000 BTC, raising their total holdings from 4.88 million to 4.93 million BTC. This shows some new interest entering the market, even as prices have pulled back.
While Bitcoin has lost ground in the short term, this kind of steady accumulation could offer some stability. It’s not a guarantee, but it’s a sign that some investors are still buying when prices dip.
Meanwhile, the key level to watch now is $112,000. If that floor gives way, prices could start moving toward the next zones around $91,400 and $70,000. These levels have seen heavy buying in the past and may do so again.
Right now, Bitcoin is still trading just above the first support band. If it stays there, it could open the door for a bounce. If not, traders will likely look lower on the chart for the next move.
The post Here Are Bitcoin’s Biggest Support Levels Ahead: Will BTC Drop to $70K? appeared first on CryptoPotato.


추천 콘텐츠

Why Businesses Need Professional Machine Design and Development Services

Bitcoin ETFs Shed $649M in a Day While Ethereum Fund Outflows Hit a Six-Day Streak


