Bitcoin Price Faces $116k Bounce Talk but Analysts Warn of Deeper Risks
TLDR:
- Bitcoin trades at $112,333 with a 5.60% weekly drop, raising questions about the next move in price action.
- Analysts warn Bitcoin must dip further before any bounce holds, citing weak retracement and trapped stops.
- Market watchers highlight $106,666 as the bull market support band, critical for Bitcoin’s next direction.
- CME gap between $92,700 and $92,000 could be tested if BTC closes below support, opening room to $85K.
Bitcoin traders are watching as the crypto slides through another week without a strong recovery. The asset dipped into new lows but failed to clear enough liquidity to inspire a confident rebound.
Analysts argue that any bounce without a deeper dip risks fading fast. At the same time, long-term levels point toward heavier moves if support gives way. For investors, the next few days could determine whether BTC tests higher resistance or slides to fresh lows.
Bitcoin Price Struggles Near Key Levels
Per CoinGecko, Bitcoin trades at $112,333 after losing 0.71% over the past day and 5.60% in the last week.
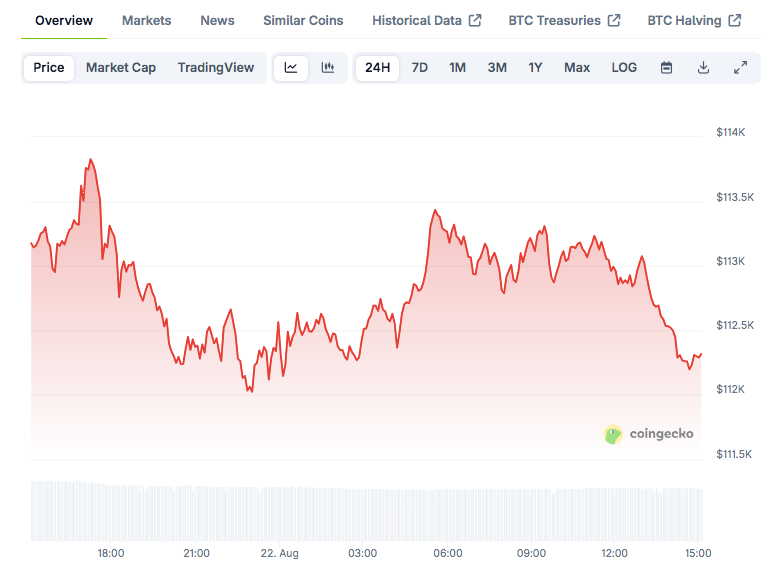 BTC price on CoinGecko
Market strategist Zen noted that BTC touched liquidity levels near $111,850 but failed to trigger a stop-clearing move. He suggested that without flushing lower, a rebound lacks strength and would likely stall before breaking higher.
Zen highlighted resistance levels between $114,150 and $116,455, while lower supports remain at $111,850, $110,653, and $109,145. His liquidation heatmap pointed to trader clusters around $113,915 and $111,900, areas where volatility could intensify.
According to him, the market may need one more dip before a rally toward $116,000 becomes sustainable.
The lack of momentum has left traders cautious as BTC enters another trading cycle with weak buying pressure. Despite the decline, many expect an eventual bounce, though the timing remains unclear.
Analysts Highlight Bearish Macro Signals
Egrag Crypto, another analyst, pointed to monthly chart structures that warn of further downside.
He noted a “shooter candle” pattern from December 2024 that triggered a 31% decline and said the current candle risks repeating that setup. In his view, a close below the bull market support band at $106,666 would almost guarantee a move toward the CME gap.
That unfilled gap sits between $92,700 and $92,000, an area Egrag believes could attract price in the coming weeks. He cautioned that if broken, BTC might even dip to $85,000 before finding new momentum.
Despite these risks, he reiterated that the broader bull cycle remains intact, though turbulence is likely ahead.
Investors now face a divided outlook: short-term traders looking for a rebound near $116K, and macro analysts preparing for a deeper correction. Both camps agree on one thing: Bitcoin’s next decisive move will likely unfold within days, not months.
The post Bitcoin Price Faces $116k Bounce Talk but Analysts Warn of Deeper Risks appeared first on Blockonomi.


추천 콘텐츠

Crypto mining stocks suffer brutal quarterly slump

Southwestern National Bank Introduces New Brand and Trade Name