

Coinbase Stock Price Jumps 16% As $2B Buyback Offsets Earnings Miss

Key Insights:
- Coinbase stock price jumped 16% to $164.32 after Cathie Wood’s ARK bought $15.2 million.
- Bullish divergence formed while Money Flow shows institutional accumulation during decline.
- Double top pattern at $168 resistance, just 2% away, decides coin stock rally or reversal to $123.
Coinbase stock price surged 16.46% to $164.32 on Feb. 13. Cathie Wood’s ARK Invest bought $15.2 million worth that same day. A bullish divergence formed, signaling reversal potential. But the COIN stock rally stopped cold just below $168 resistance.
A double top pattern is forming at this exact level. A break above opens the path to $199 and $258, while a failure would send the COIN stock back to $123 support.
Coinbase Stock Price Surges 16%
ARK Invest purchased shares across three ETFs on Feb. 13. ARKK bought 66,545 shares. ARKW added 16,832 shares. ARKF acquired 9,477 shares. The total came to approximately $15.2 million. This reversed a prior selling spree where ARK dumped $39 million worth earlier in February.
Wood has a pattern of rotating within crypto-exposed names. She sells high and buys low, attempting to time bottoms. The $15.2 million purchase came after the Coinbase stock price fell approximately 31% over the previous month.
ARK views the selloff as overdone relative to the company’s long-term potential.
The timing aligned with a technical signal. Bullish divergence formed between Feb. 8 and Feb. 13. Coinbase stock price made a lower low near $140 during this period. The RSI indicator simultaneously made a higher low. This pattern shows buyers stepping in even as the price falls. It signals weakening downside momentum and potential reversal.
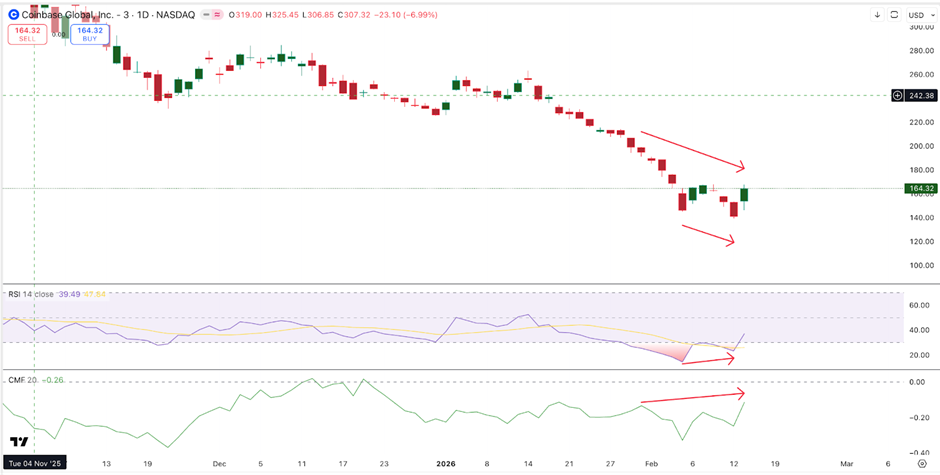 Coinbase Stock Price Bullish Metrics | Source: TradingView
The 16% surge confirmed the divergence worked. Volume spiked to over 32 million shares, showing strong participation. The move erased two weeks of losses in a single session. Momentum shifted quickly from bearish to cautiously bullish.
Bullish Divergence and Money Flow Show Institutional Accumulation
Chaikin Money Flow from the earlier chart showed institutional accumulation during the decline. Between Jan. 8 and Feb. 13, the crypto stock price trended steadily downward. CMF trended upward during that same period. This divergence indicates that large, sophisticated investors were buying while the price fell.
CMF measures the relationship between price and volume to determine if money is flowing in or out. Rising CMF during falling prices is a classic accumulation signal. Smart money builds positions quietly during weakness. Retail sees red candles and sells. Institutions see opportunity and accumulate.
The month-to-date decline of 31% created the setup. Coinbase stock price dropped from higher levels around $190 in early February. Weak sentiment dominated after the stock failed to hold gains. But underneath the surface, CMF showed a different picture. Big money was buying the dip.
Q4 2025 earnings added context to the weakness. The company swung to a $667 million GAAP net loss, ending a profitability streak. Transaction revenue dropped 37% to $983 million amid softer crypto trading volumes. The crypto market slump directly impacted results.
But management announced a $2 billion share buyback program. This signals confidence in intrinsic value and a strong cash position. The company is diversifying beyond spot trading into stablecoins, payments, lending, and derivatives. The goal is to reduce dependence on volatile crypto cycles.
Double Top Pattern Makes $168 Critical Level for Coinbase Stock Price
Coinbase stock price needs a daily close above $168.20 to confirm the breakout. The stock touched this level briefly during the surge but could not hold it. Sellers stepped in at resistance, preventing further gains. This creates a double top pattern, which is bearish.
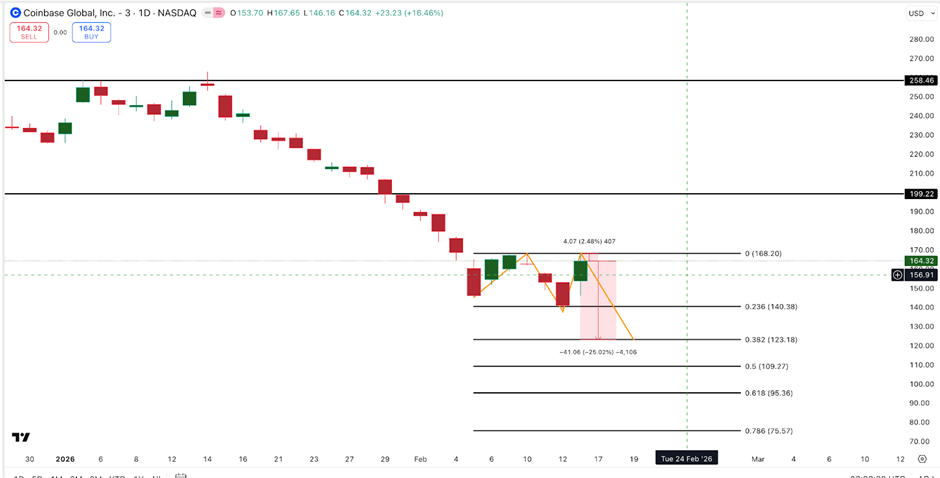 Coinbase Stock Price Levels | Source: TradingView
The first top formed earlier in February around $168. The stock rejected that level and sold off. Now it has returned to test the same resistance again. Failing twice at the same level typically leads to breakdown. Traders who bought near resistance start selling to cut losses.
Breaking above $168 changes everything. It would invalidate the double top pattern. The next targets sit at $199.22 and $258.46 based on prior resistance levels. The rally would have room to run after escaping the pattern. Momentum buyers would likely pile in on the breakout.
Failure at $168 sends Coinbase stock price back toward $140 support. Breaking below that level triggers the double top measured move down to $123.18. That represents 25% additional downside from current levels. The margin between success and failure is just 2%. The next few sessions determine which path plays out.
The post Coinbase Stock Price Jumps 16% As $2B Buyback Offsets Earnings Miss appeared first on The Coin Republic.
추천 콘텐츠

Russians flock to US messenger imo amid restrictions on Telegram and WhatsApp

FCA komt in 2026 met aangepaste cryptoregels voor Britse markt
