Bitcoin Price Analysis: BTC at Critical Point for Bull Run Continuation
Bitcoin’s price is currently sitting at a crucial level that could shape market direction in the coming weeks. Buyers and sellers are locked in a tight battle, and the market appears to be standing on the edge of a potential breakdown.
BTC Price Technical Side
By Shayan
The Daily Chart
On the daily chart, Bitcoin has recently slipped below the large ascending channel that had been driving its uptrend over the past few months. The failure to hold above $120K is a bearish signal, and with the $110K support and the 100-day moving average now at risk of breaking, the market could be heading for a sharp drop toward the $100K zone, where the 200-day moving average also resides.
The RSI is holding below 50, further confirming bearish momentum and strengthening the case for continued downside. At this stage, only a strong wave of buying pressure could prevent a deeper decline and stabilize the market.

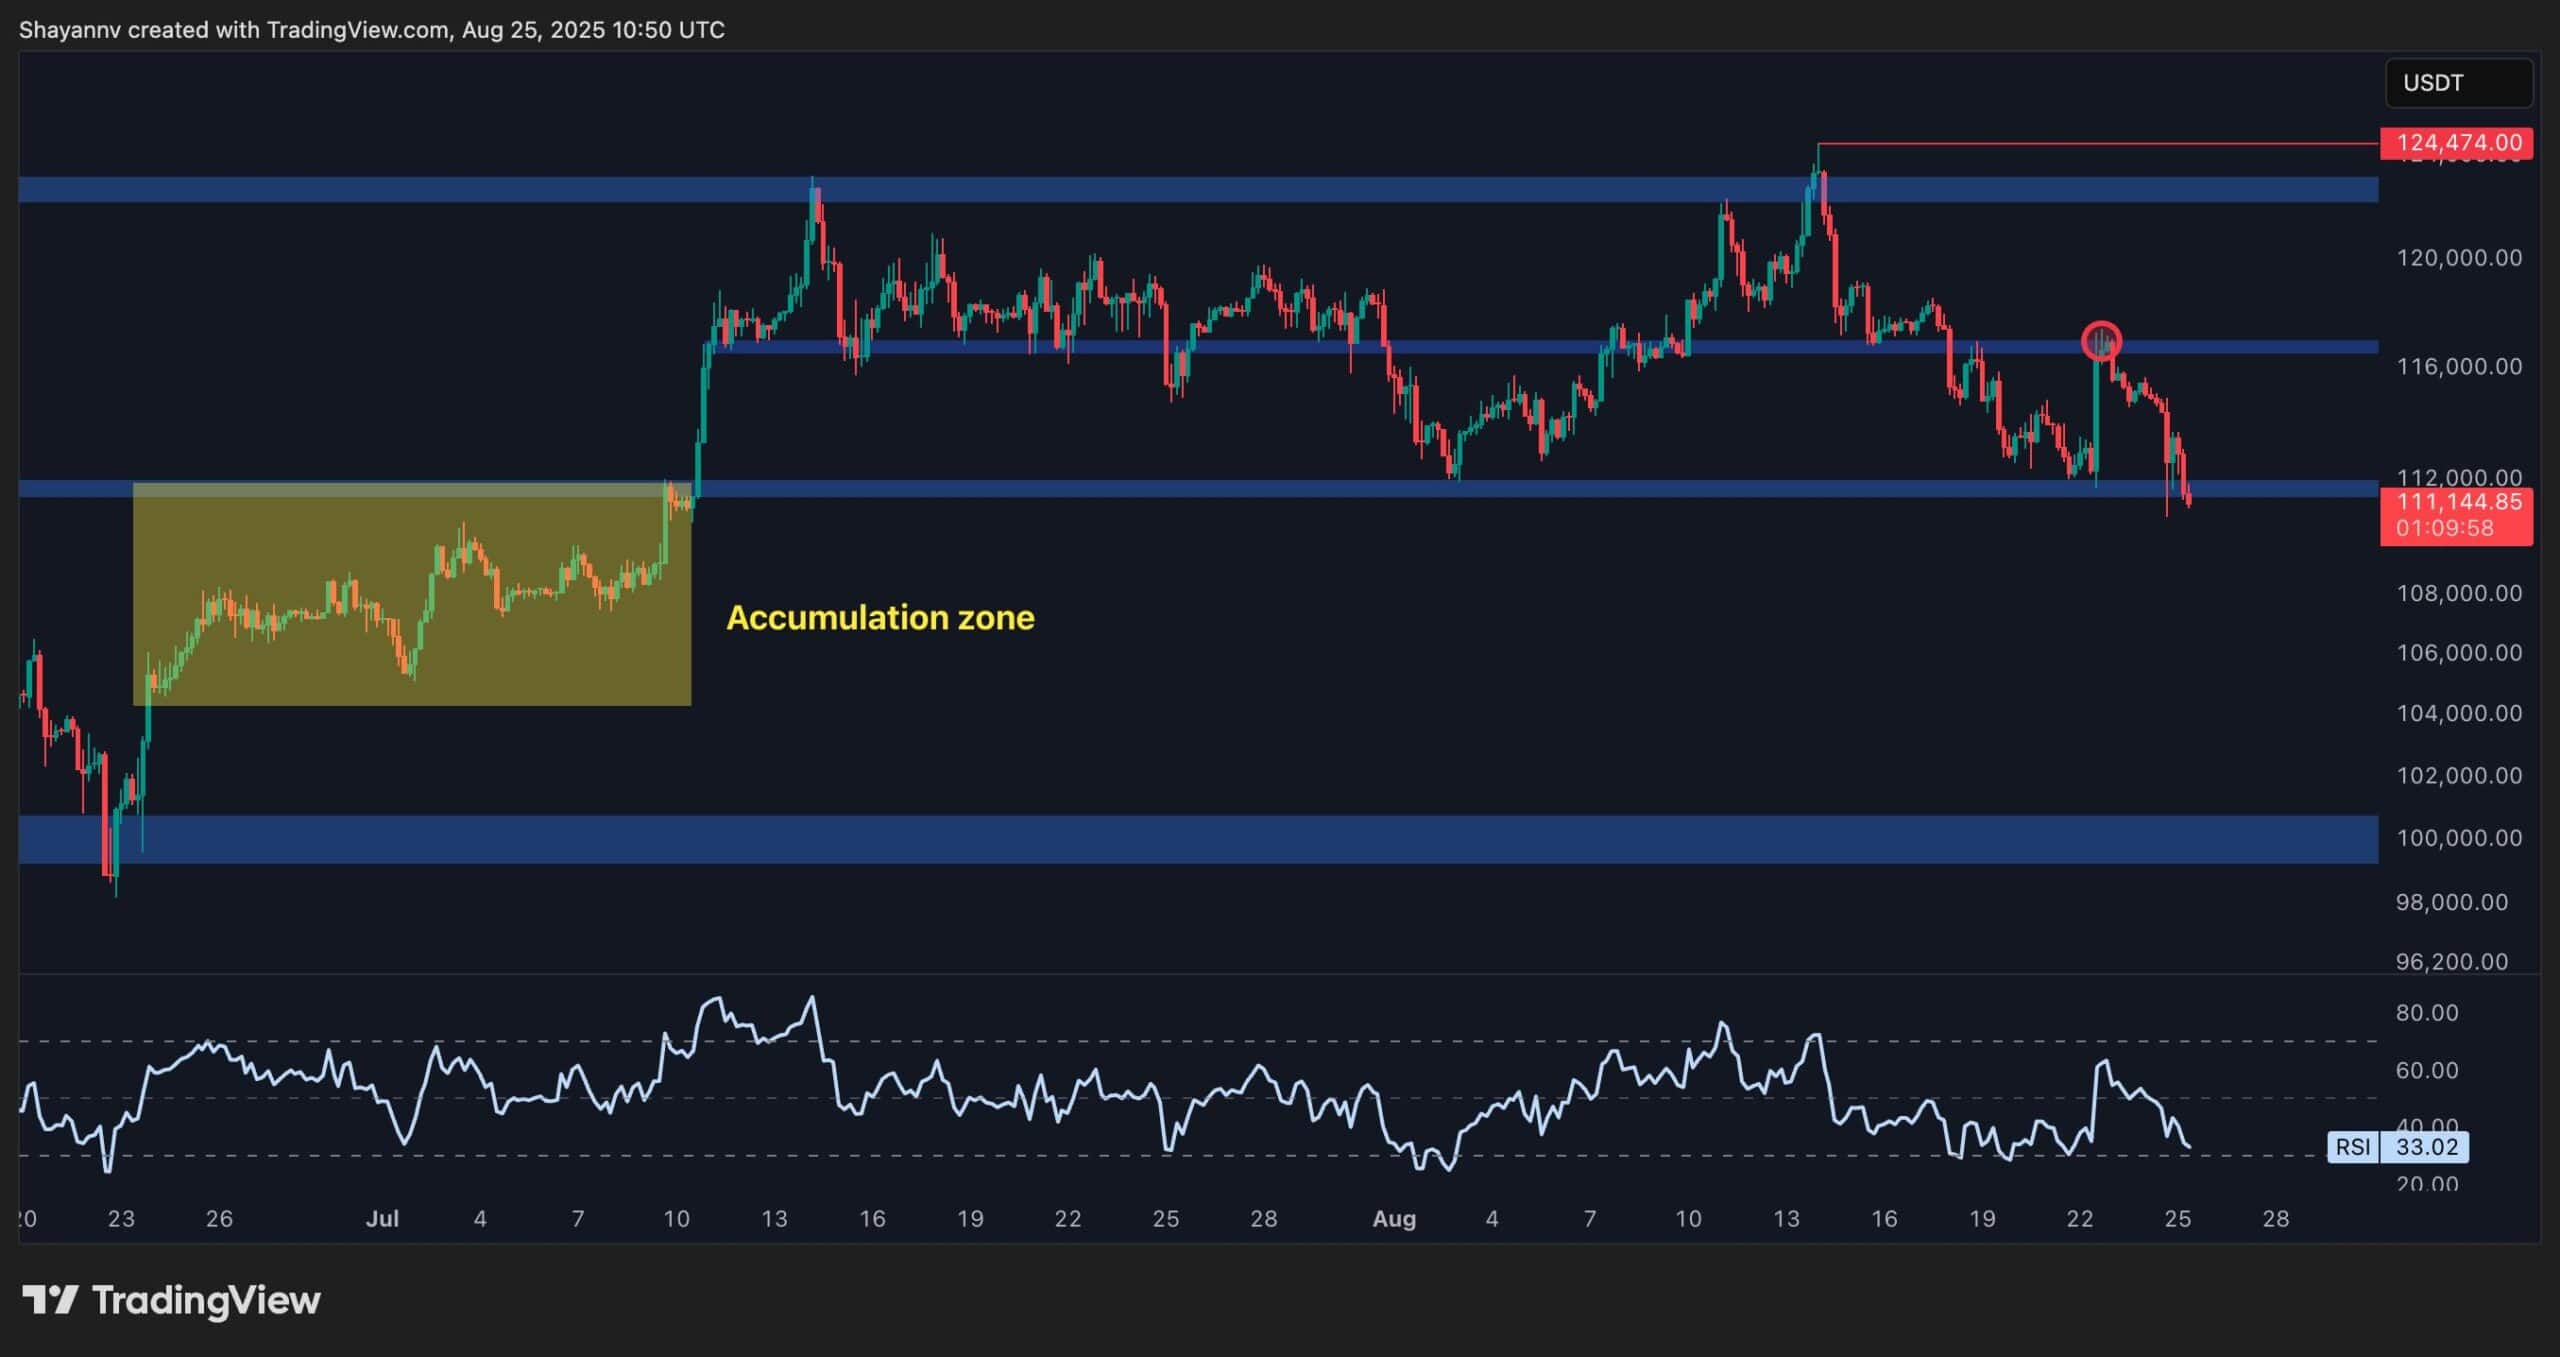
The 4-Hour Chart
The 4-hour chart shows a clear fake breakout and rejection around the $116K resistance, signaling that even the anticipation of lower interest rates has not been enough to spark a new rally. This is a bearish sign, as markets failing to react positively to good news often suggest underlying weakness.
Currently, the $111K support is breaking down, which could pave the way for a swift decline toward the critical $100K zone. While the previous accumulation between $105K and $110K may generate some buying interest and temporary support, the overall market structure points to a higher probability of further downside.
On-Chain Analysis
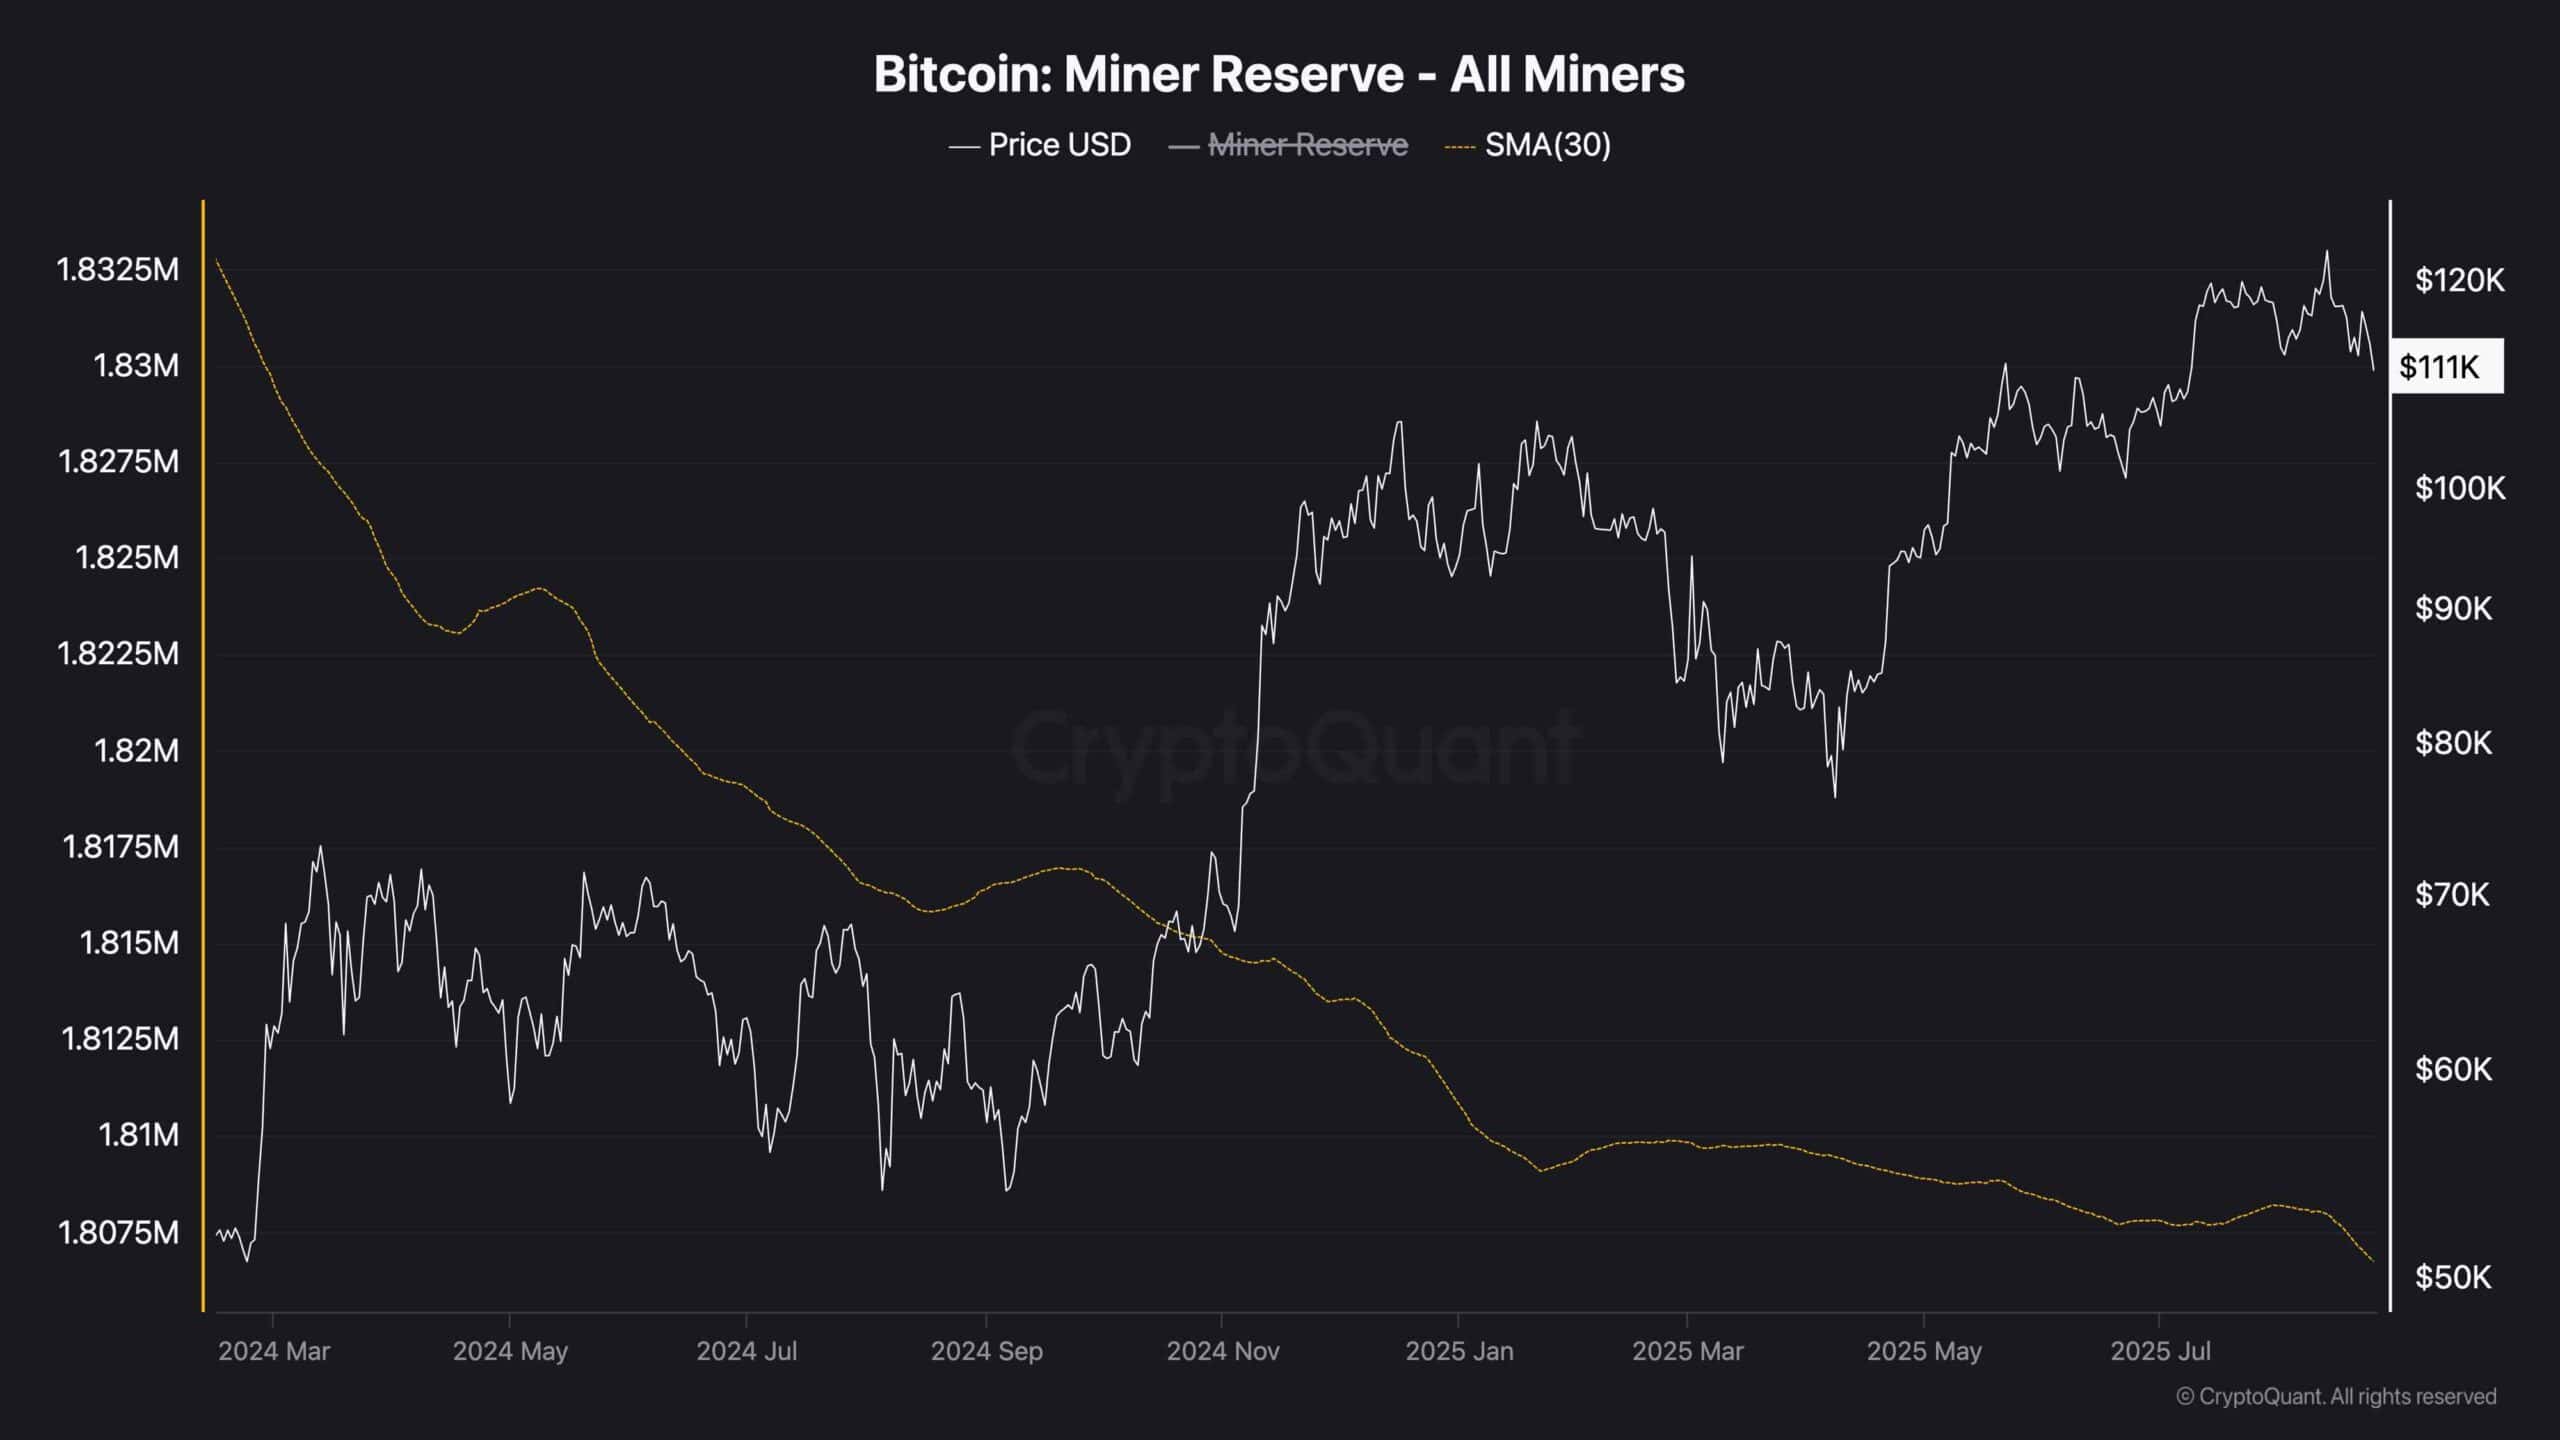
Miner Reserve (30-Day Moving Average)
Bitcoin miners have been consistently selling their holdings over the past couple of years, mainly to cover operational costs. While expected, this steady outflow adds extra selling pressure to the market, which can weigh on price performance.
In recent days, the decline in miner reserves has accelerated, signaling an increase in selling activity. This surge in supply is likely one of the factors contributing to the recent downturn following Bitcoin’s new all-time high a few weeks ago. If this trend continues and demand fails to absorb the additional supply, the market could face deeper downside pressure.
The post Bitcoin Price Analysis: BTC at Critical Point for Bull Run Continuation appeared first on CryptoPotato.


추천 콘텐츠

How to Spot a South African Cyber-Scam Before You Click “Pay”

USDC Exchange Inflows Hit $350M—Traders Buying The Bitcoin Dip?