

Biggest Dogecoin Cycle Explosion Looms If This Trigger Fires: Analyst
The higher-timeframe momentum gauges for Dogecoin are quietly resetting, and two widely followed chartists say the setup that preceded DOGE’s biggest advances is close to reappearing.
In a new monthly chart, Kevin (@Kev_Capital_TA) stacks three market cycles and highlights a repeating structure: long, descending consolidations that resolve into impulsive breakouts, followed by measured Fibonacci 1.618 extension targets penciled far above the range.
One Trigger Could Ignite Dogecoin’s Cycle Surge
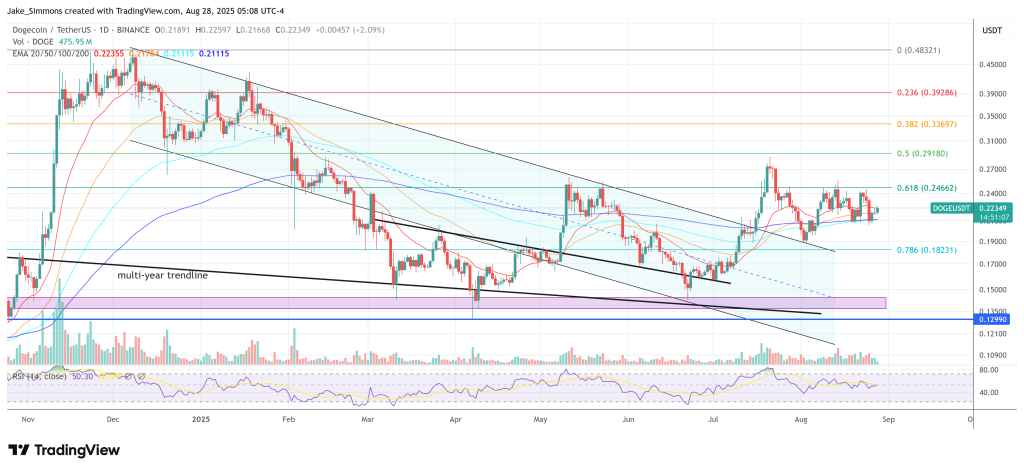
The present cycle has already cleared its multi-month falling wedge on the 1-month chart and, critically, completed a clean throwback: price pushed through the descending trendline, retested it from above, and turned higher, converting former resistance into support. On Kevin’s canvas, DOGE trades in the ~$0.23 area on the monthly scale, sitting beneath layered horizontal supply bands but above the wedge ceiling that capped it through the consolidation.
Momentum is the hinge of Kevin’s thesis. “Anytime we saw Monthly Stoch RSI crosses on #ogecoin outside of the bear market along with an uptrending Monthly RSI ultimately lead to massive rallies to the upside,” he writes. He adds that “the goal is to get the StochRSI to cross the 20 level and show follow through as anything below that level is a sign of weak momentum. Currently crossing to the upside and at the 13 level.”
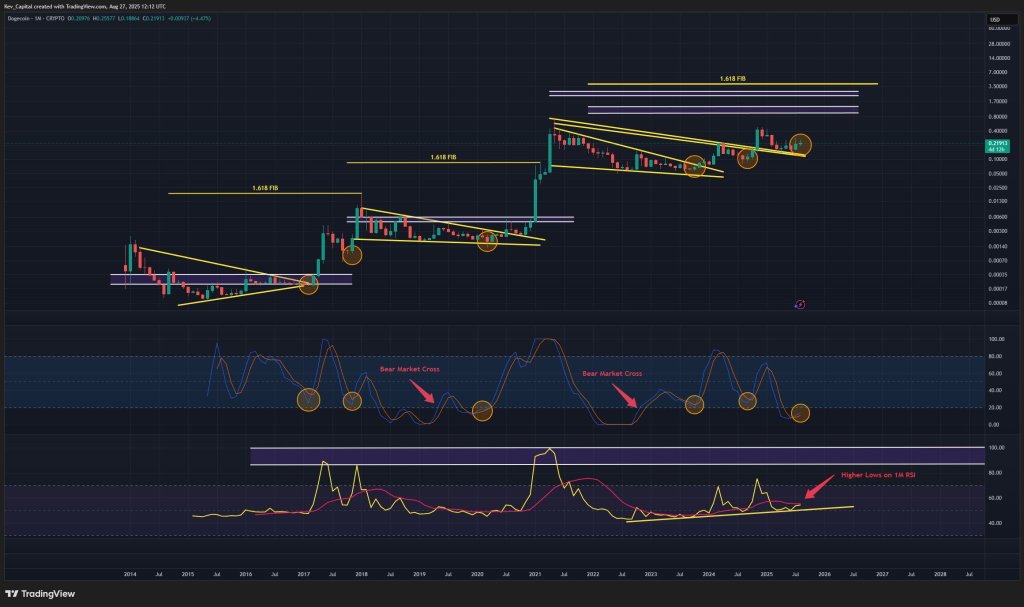
His lower panel draws a rising diagonal on the 1-month RSI—explicitly labeled “Higher Lows on 1M RSI”—to underscore that longer-term momentum troughs have been stepping up even as price coiled inside the wedge.
Kevin also reiterates the inter-market backdrop he’s watching: “If BTC can move higher and not putter out on us and we ultimately get ETH into price discovery with a dropping BTC Dominance then like I have said before DOGE’s biggest move of the cycle is likely. Just need a little more time and for BTC and the macro to support the move. That’s the reality not engagement farming hopium.”
With the structural breakout and retest in hand, the remaining confirmation on his checklist is mechanical—see the monthly StochRSI reclaim and hold above 20 while the monthly RSI preserves its pattern of higher lows.
On targets, Kevin has previously mapped an aggressive trio of Fibonacci extensions above the last cycle’s peak: 1.618 at $3.97, 1.65 at $4.33, and 1.703 at $5.00. In prior cycles on the same template, wedge resolutions were followed by vertical expansion toward comparable 1.618 objectives; these three levels now serve as forward waypoints should trend acceleration resume.
Ichimoku Cloud Analysis For DOGE
A complementary, mid-cycle lens from Cantonese Cat (@cantonmeow) uses 2-week candles with Ichimoku Cloud to track the transition. “It’s doing more or less what I thought it would do from 2 months ago,” he notes, “where it bounced off the cloud, reclaiming Tenkan (blue line) as support, and is trying to launch itself above the green Ichimoku cloud on the right.”
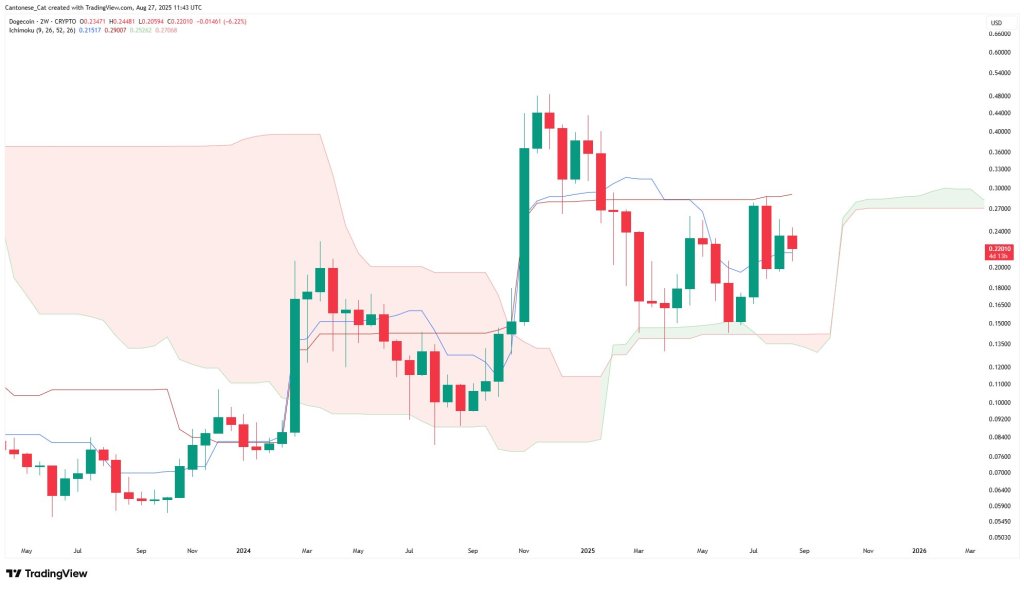
In Ichimoku terms, that sequence—cloud bounce, Tenkan regain, then an attempt to clear the top of the forward green cloud—aligns with a shift from corrective to trending conditions on the 2-week timeframe and dovetails with Kevin’s higher-timeframe momentum trigger.
Taken together, the two studies narrow the focus to a clear condition set. Tactically, the 2-week chart is pressing the cloud top after reclaiming the Tenkan as support. And cyclically, the 1-month StochRSI is curling up from ~13 toward the threshold Kevin considers decisive at 20 while the 1-month RSI maintains a series of higher lows. If those momentum thresholds are secured against a supportive majors tape—firmer BTC, ETH in discovery, and declining BTC dominance—the Fibonacci extensions at $3.97, $4.33, and $5.00 could be DOGE’s price targets for this cycle.
At press time, DOGE traded at $0.223.


추천 콘텐츠

Rape joke by Bacolod broadcaster sparks outrage, suspension

SelfCAD Bridges the Gap to Professional Design with Upcoming Gemini AI Integration

SGX FX Partners With Chainlink to Bring OTC FX Data Onchain


인기 뉴스
더보기
