

Top 3 Price Prediction: Bitcoin, Ethereum, Ripple – BTC, ETH, and XRP downtrend eases, focus shifts to recovery
- Bitcoin price hovers around $107,600 on Monday, after sliding 4.62% last week.
- Ethereum price holds above its daily support at $4,232, eyeing a potential recovery ahead.
- Ripple’s XRP is nearing its key daily support at $2.72, having corrected more than 8% in the previous week.
Bitcoin (BTC), Ethereum (ETH), and Ripple (XRP) start the week on a cautious note after sharp declines in the previous week. BTC hovers around $107,600 at the time of writing on Monday, while ETH and XRP defend their key support levels. While market conditions still remain cautious, traders' focus shifts to a potential recovery for the top three cryptocurrencies this week.
Bitcoin could recover if the daily support holds
Bitcoin price faced rejection from its previously broken ascending trendline on August 23 and declined by 7.43% until Sunday. At the time of writing on Monday, it continues to trade down at around $107,600, approaching its key daily support level of $105,573.
If BTC finds support around its daily level at $105,573, which also roughly coincides with the 61.8% Fibonacci retracement level at $105,386, it could recover towards its daily resistance at $116,000.
However, the Relative Strength Index (RSI) reads 36, below its neutral level of 50, and still has room for correction as it approaches oversold conditions. For the recovery rally to be sustained, the RSI must rebound from its oversold conditions and move above its neutral level.
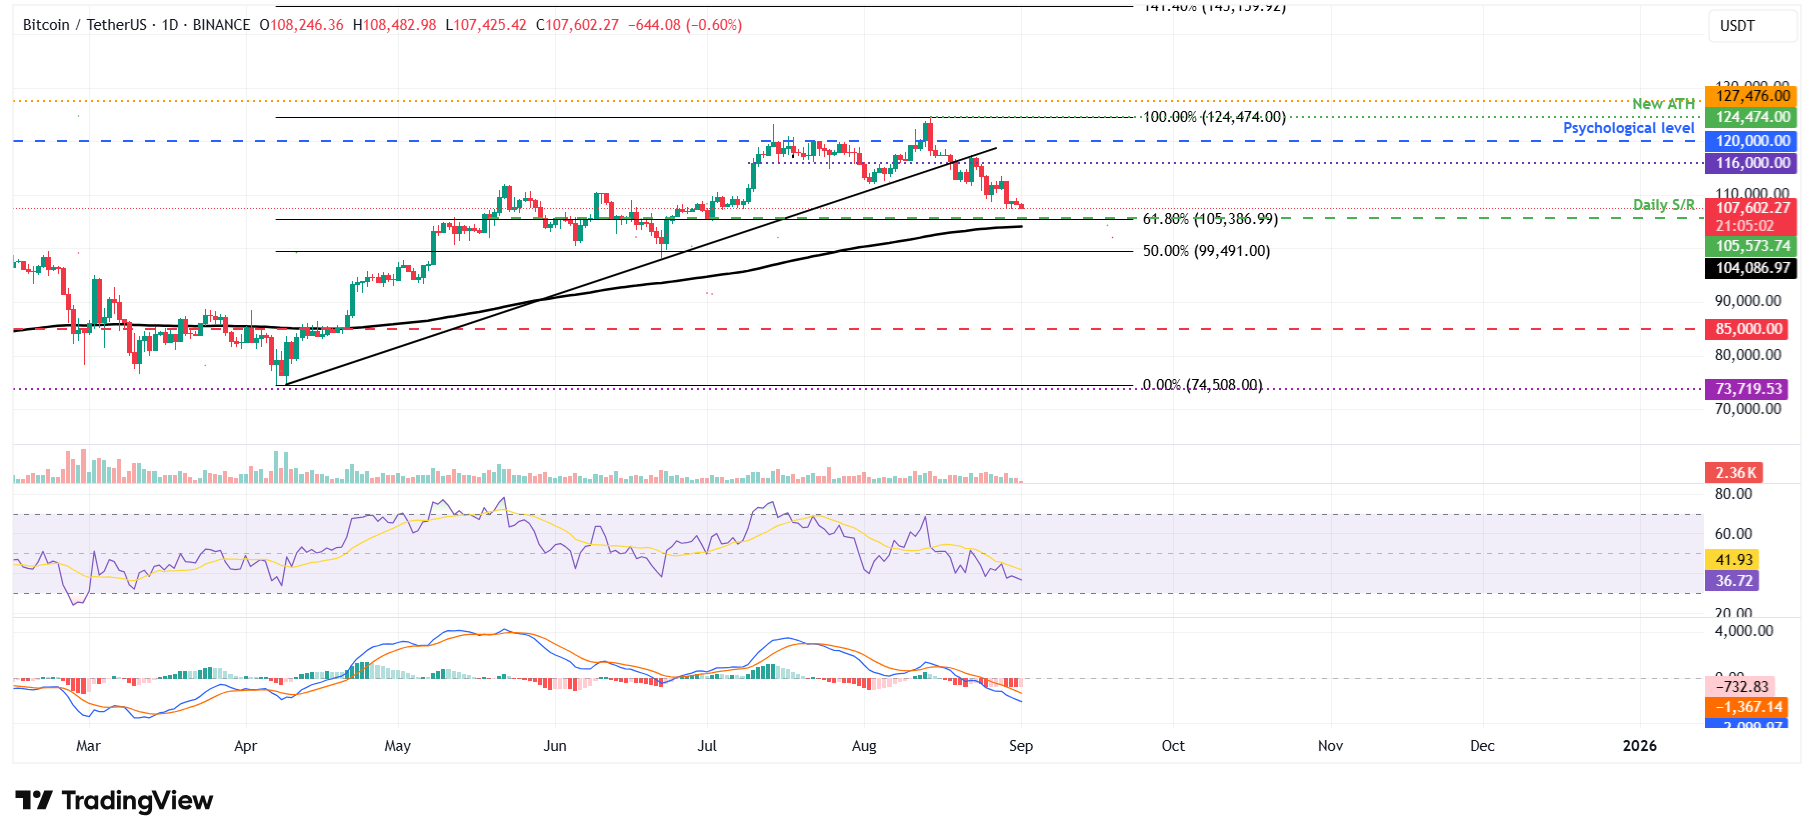
BTC/USDT daily chart
However, if BTC fails to find support around the $105,573 level, it could extend the correction toward its 200-day Exponential Moving Average (EMA) at $104,086.
Ethereum recovers as it finds support around $4,232
Ethereum price reached a new all-time high of $4,956 on August 24 but failed to maintain its upward momentum, declining by over 9% until Friday. However, it retested and found support around the daily level of $4,232 on Saturday and recovered slightly the next day. At the time of writing on Monday, it hovers around $4,390.
If the daily level at $4,232 continues to hold as support, ETH could extend the recovery toward its next daily resistance at $4,488. A successful close above this level could extend the gains toward its record high at $4,956.
The RSI on the daily chart reads 52 and is flattening around its neutral level of 50, indicating indecisiveness among traders. Meanwhile, the MACD showed a bearish crossover last week, signaling a continuation of the downward trend.
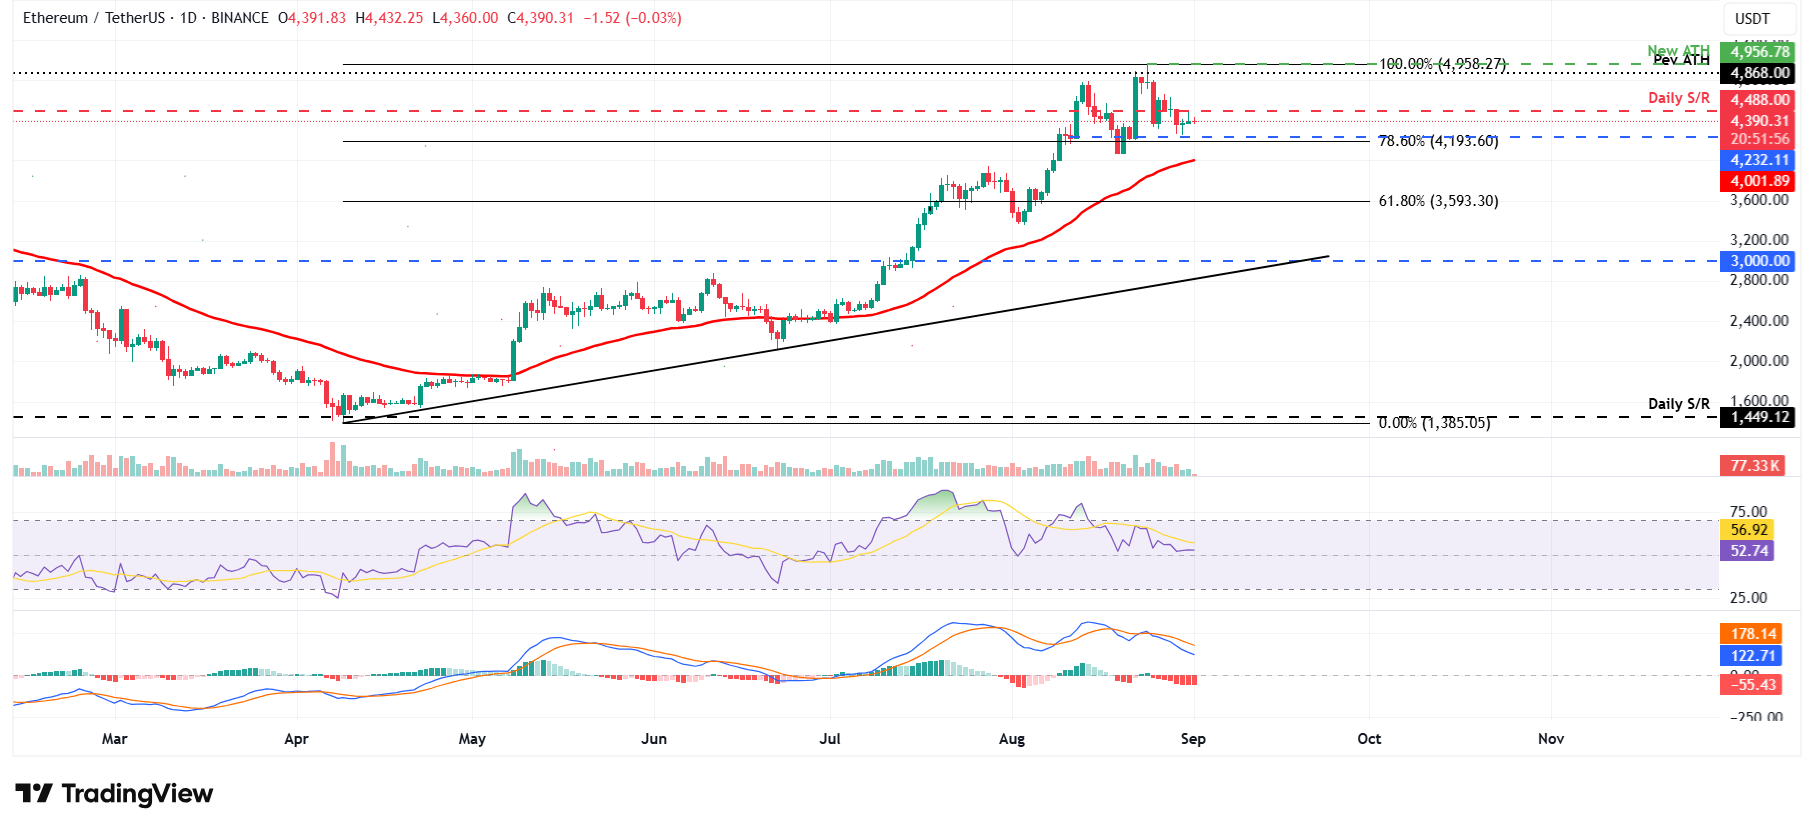
ETH/USDT daily chart
However, if ETH faces a correction and closes below the daily support at $4,232, it could extend the decline to retest its 50-day EMA at $4,001.
XRP could recover if the daily support holds
The XRP price faced rejection around the daily level of $3.40 on August 14 and declined by more than 15% in the 18 days leading up to Sunday. At the time of writing on Monday, it continues to trade down, nearing its daily level at $2.72.
If XRP finds support around its daily level at $2.72 and recovers, it could extend the recovery toward its 61.8% Fibonacci retracement level at $2.99.
Like Bitcoin, XRP’s RSI reads 38 below its neutral level of 50, and still has room for correction as it approaches oversold conditions. For the recovery rally to be sustained, the RSI must rebound from its oversold conditions and move above its neutral level.
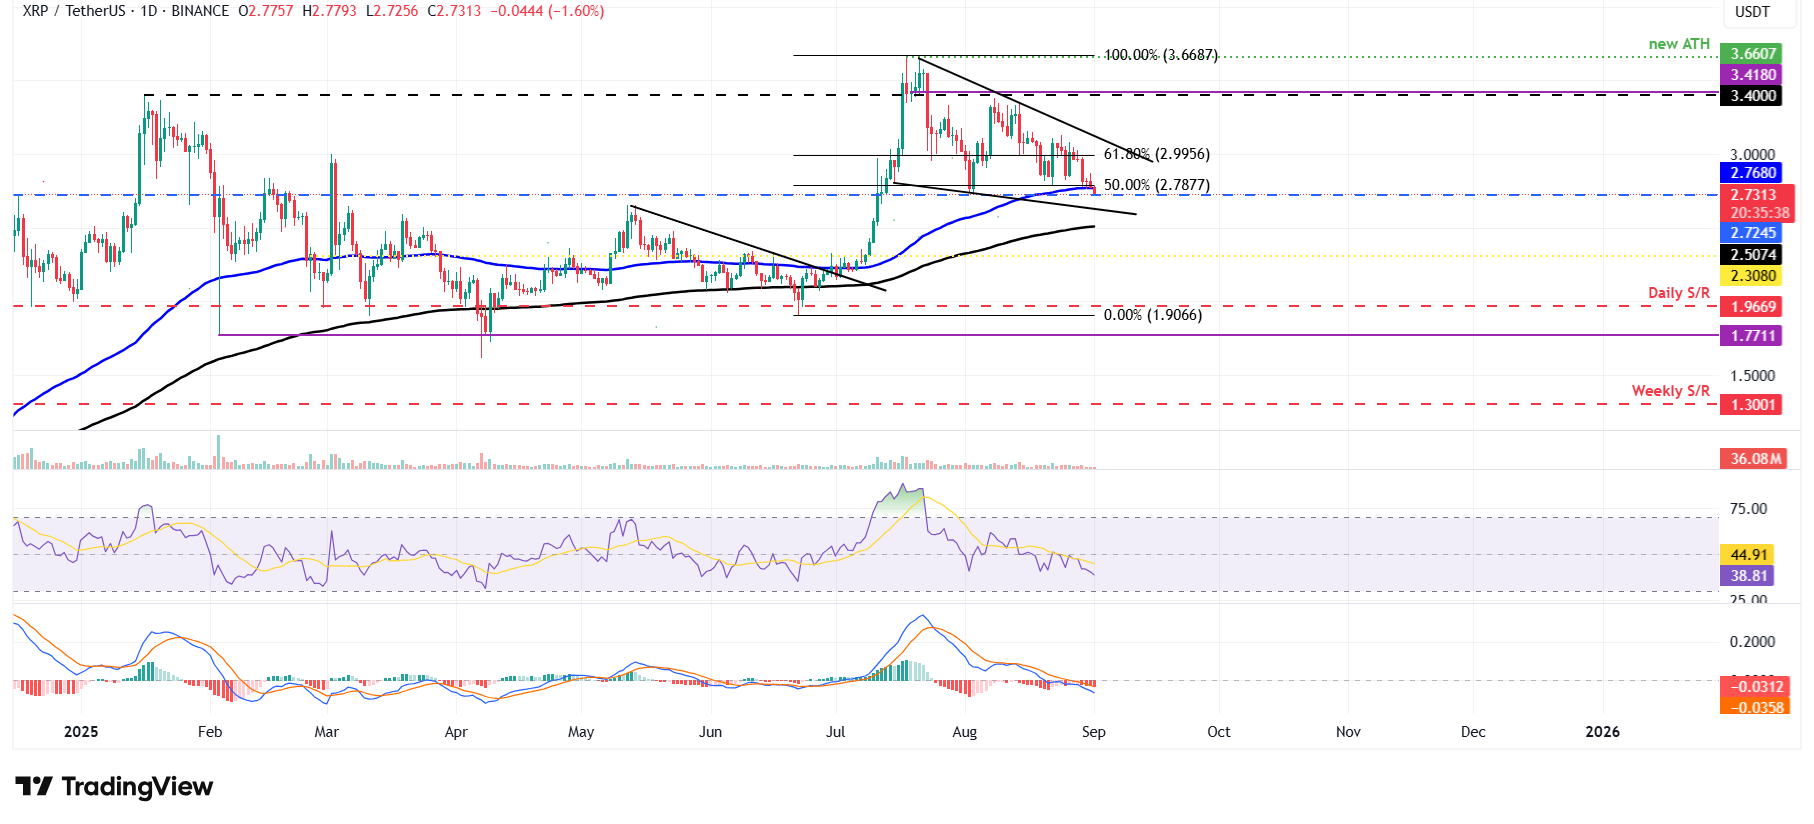
XRP/USDT daily chart
However, if XRP closes below $2.72, it could extend the decline toward its 200-day EMA at $2.50.
Bitcoin, altcoins, stablecoins FAQs
Bitcoin is the largest cryptocurrency by market capitalization, a virtual currency designed to serve as money. This form of payment cannot be controlled by any one person, group, or entity, which eliminates the need for third-party participation during financial transactions.
Altcoins are any cryptocurrency apart from Bitcoin, but some also regard Ethereum as a non-altcoin because it is from these two cryptocurrencies that forking happens. If this is true, then Litecoin is the first altcoin, forked from the Bitcoin protocol and, therefore, an “improved” version of it.
Stablecoins are cryptocurrencies designed to have a stable price, with their value backed by a reserve of the asset it represents. To achieve this, the value of any one stablecoin is pegged to a commodity or financial instrument, such as the US Dollar (USD), with its supply regulated by an algorithm or demand. The main goal of stablecoins is to provide an on/off-ramp for investors willing to trade and invest in cryptocurrencies. Stablecoins also allow investors to store value since cryptocurrencies, in general, are subject to volatility.
Bitcoin dominance is the ratio of Bitcoin's market capitalization to the total market capitalization of all cryptocurrencies combined. It provides a clear picture of Bitcoin’s interest among investors. A high BTC dominance typically happens before and during a bull run, in which investors resort to investing in relatively stable and high market capitalization cryptocurrency like Bitcoin. A drop in BTC dominance usually means that investors are moving their capital and/or profits to altcoins in a quest for higher returns, which usually triggers an explosion of altcoin rallies.


추천 콘텐츠

AEVIS VICTORIA Shareholders Approve All Proposals at 2025 AGM

Mike Johnson 'fed up' with Trump as he ditches White House for first time: insiders

How to Spot a South African Cyber-Scam Before You Click “Pay”


인기 뉴스
더보기
