

What To Expect From HBAR Price In September 2025?
Hedera (HBAR) faced a bearish August, with selling pressure dominating most of the month. Outflows weighed heavily on the asset, pulling prices lower and limiting recovery attempts.
However, historical data show that HBAR has occasionally rebounded after extended weakness, suggesting September could provide some relief if conditions improve.
Hedera Has An Interesting History
HBAR’s quarterly performance this year has been notably stronger compared with the previous three years. Despite the struggles in August, the token has held up better than in past cycles, reflecting gradual improvements in resilience. A green Q3 would mark a significant milestone for the network’s progress.
If HBAR closes Q3 in profit, it would represent the first positive quarter in four years. More importantly, it would also be the first quarter of 2025 to end in the green. Such an outcome could signal improving investor sentiment, even as short-term volatility continues to impact performance.
Want more token insights like this? Sign up for Editor Harsh Notariya’s Daily Crypto Newsletter here.
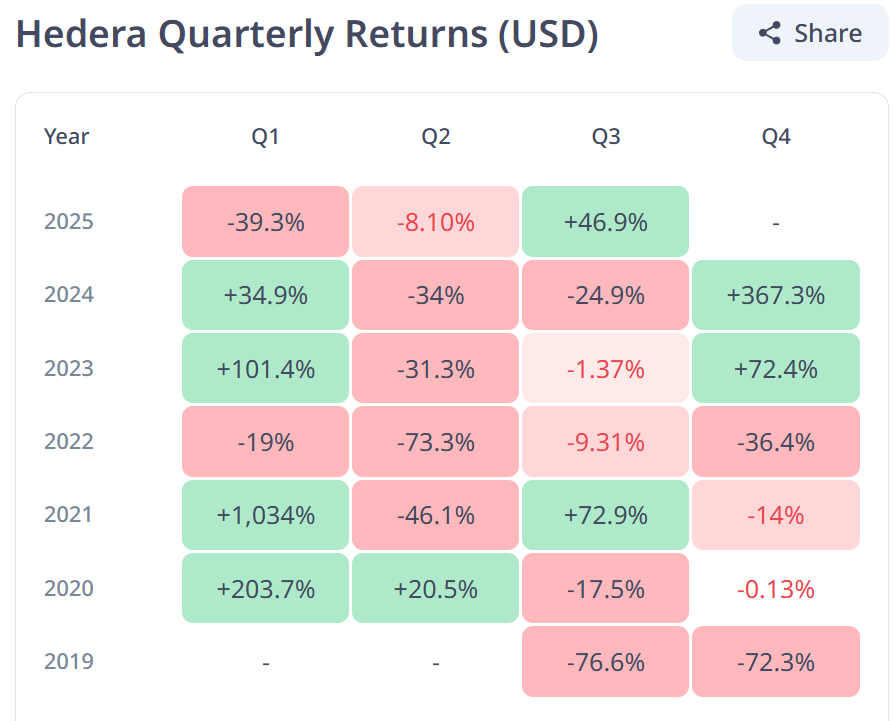 HBAR Quarterly Returns Historical. Source: CryptoRank
Technical indicators point to challenges ahead. The Chaikin Money Flow (CMF) shows strong outflows dominating HBAR for the past two months. This sustained selling pressure has been one of the key reasons for the token’s decline, limiting any momentum that might have emerged from network growth or broader adoption.
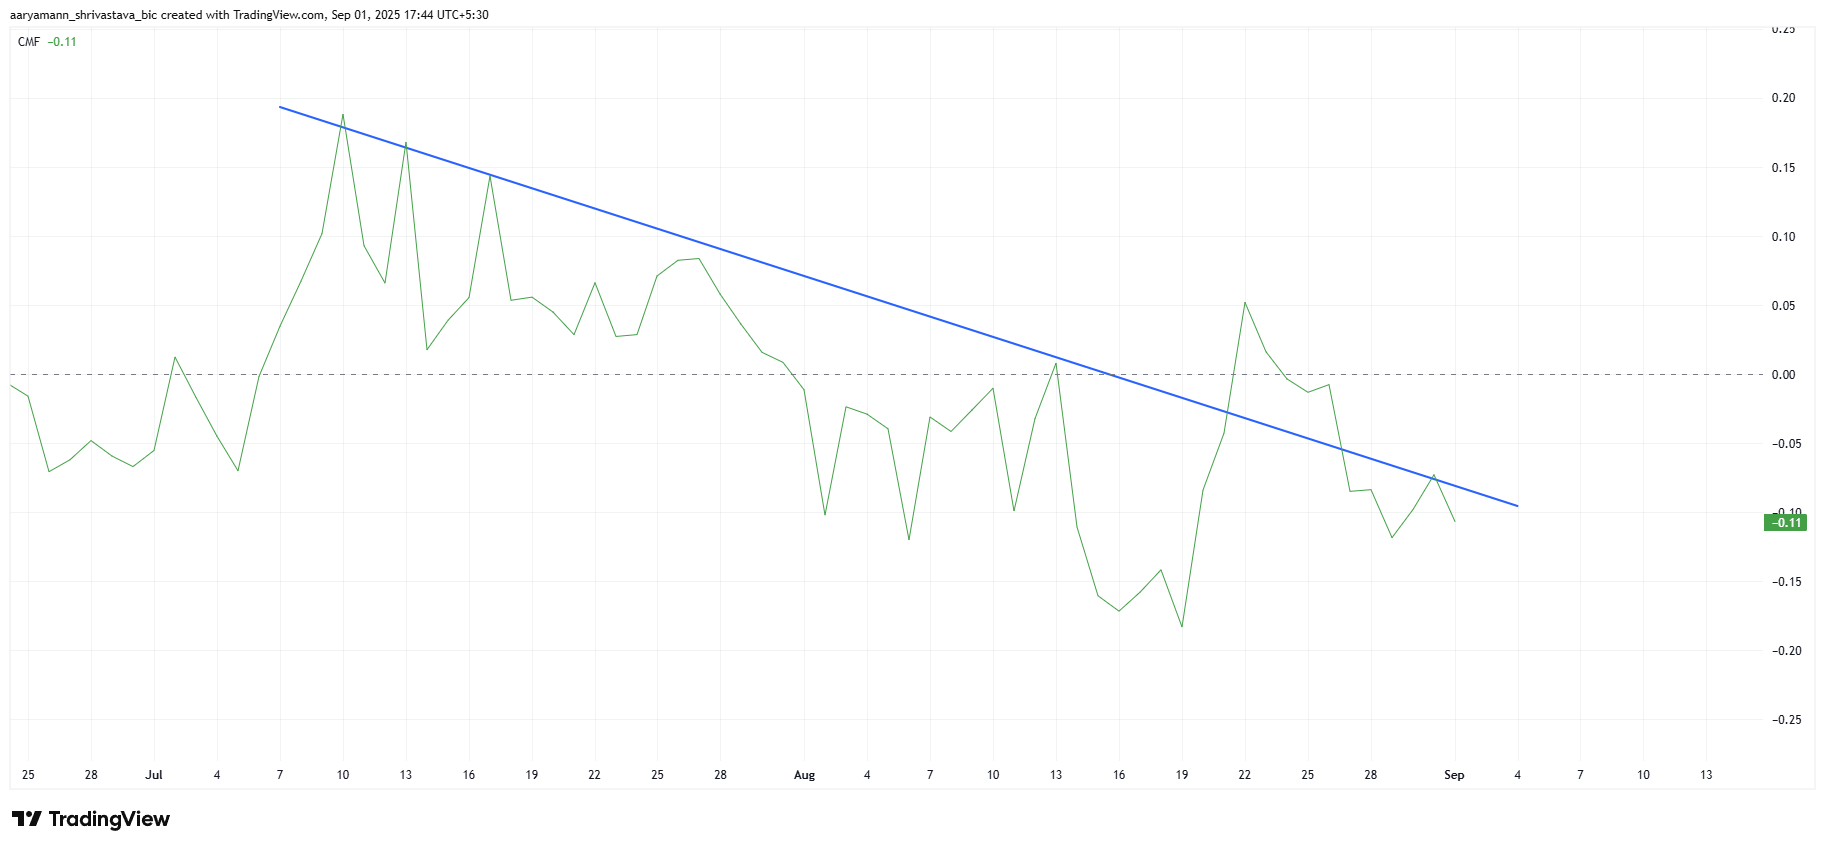 HBAR CMF. Source: TradingView
Outflows indicate two key concerns: rising investor skepticism and broader market-driven selling. Bitcoin’s sharp decline has amplified pressure, as HBAR maintains a high 0.92 correlation with BTC. This close connection means Hedera’s performance is heavily influenced by Bitcoin’s trajectory, making September’s outlook dependent on BTC’s ability to stabilize.
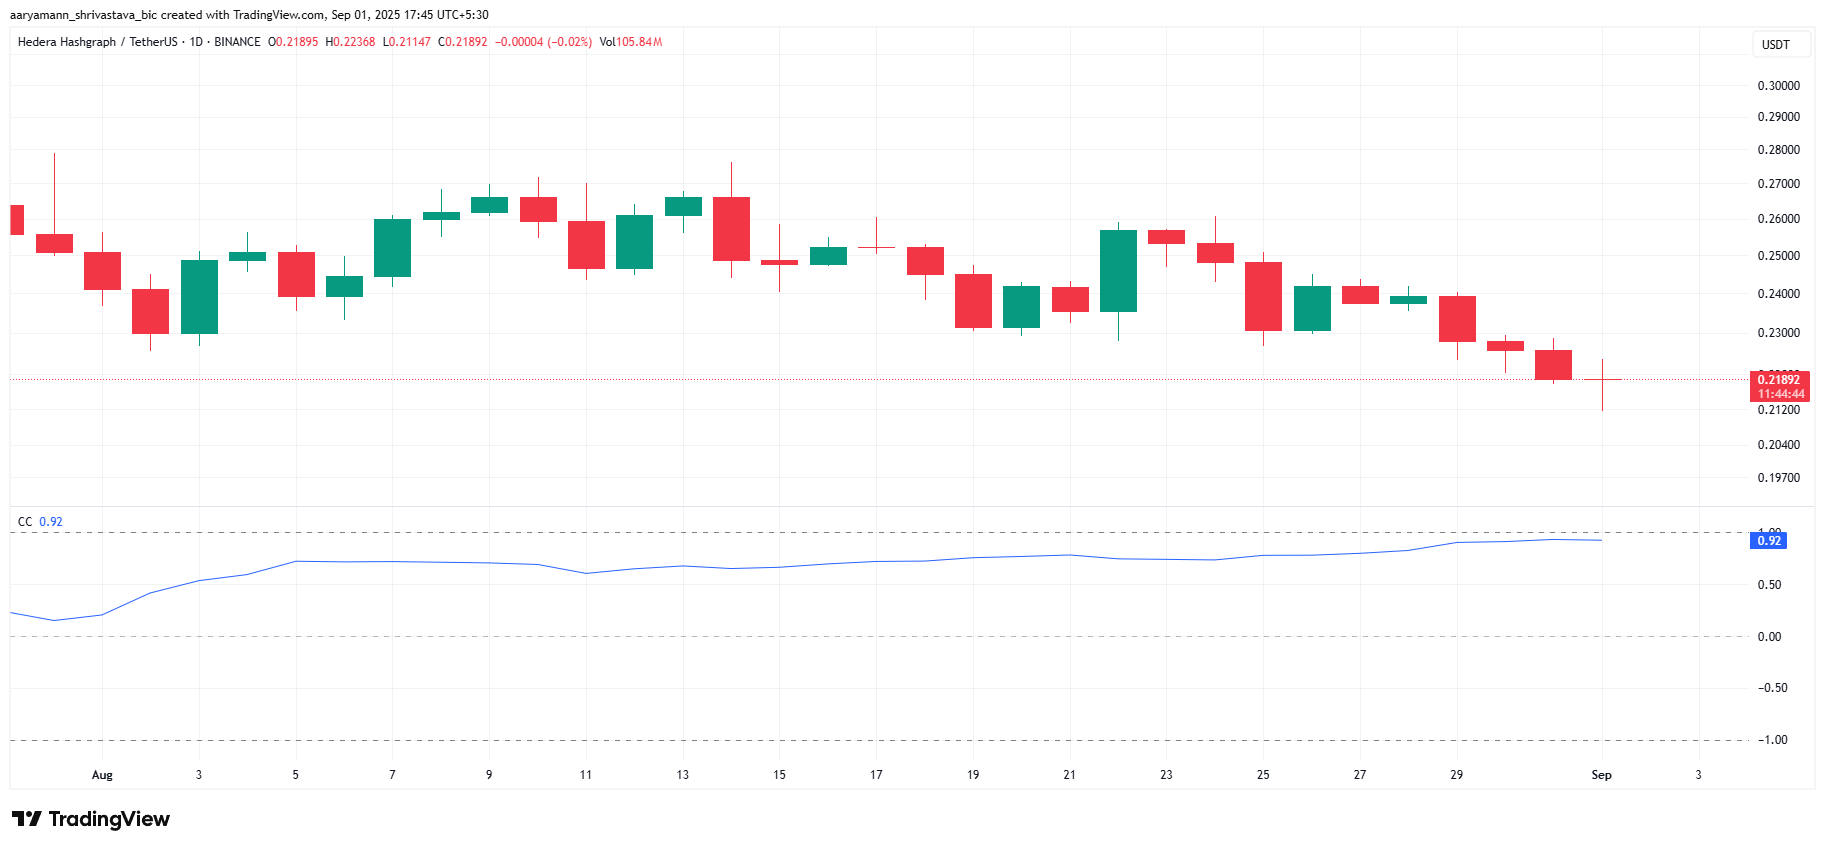 HBAR Correlation With Bitcoin. Source: TradingView
HBAR Price Faces Challenge
At the time of writing, HBAR trades at $0.218, down 9% over the past month. The persistent outflows suggest continued weakness, leaving the altcoin vulnerable to further decline. Should selling continue, HBAR could slip to $0.205, extending its drawdown and reinforcing bearish momentum in the short term.
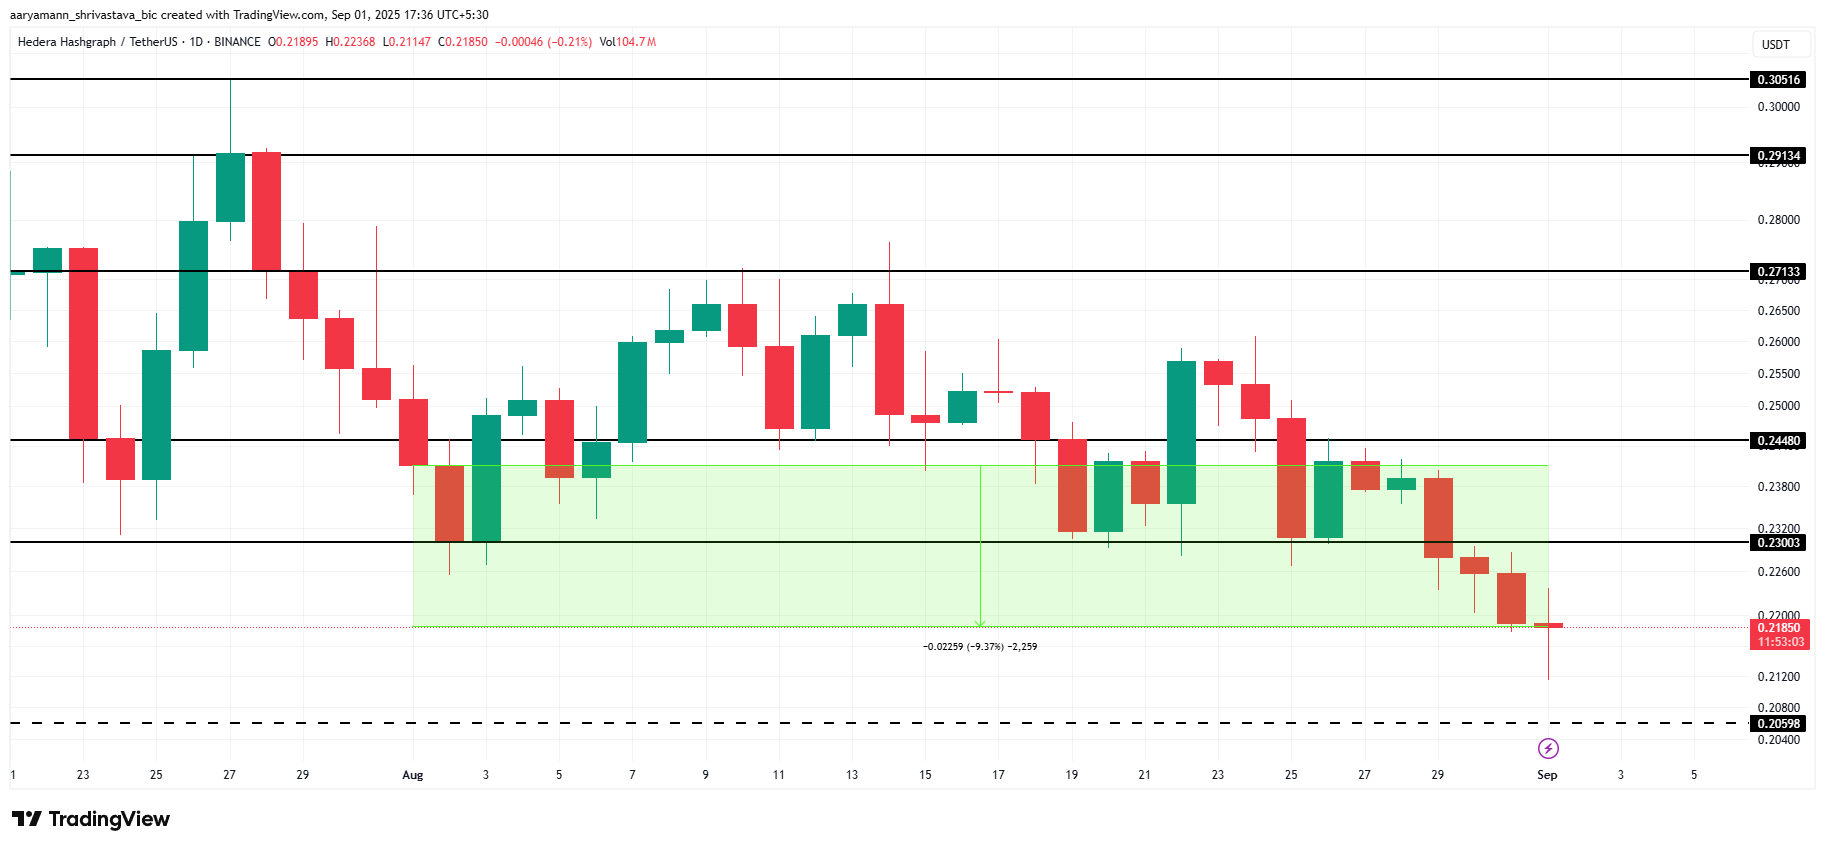 HBAR Price Analysis. Source: TradingView
Historically, September has been a poor month for HBAR. On average, the token has declined 10% during this period, with a median drop of 5%. Based on this pattern, the probability of another drawdown remains elevated, aligning with current technical signals that highlight weakening support levels.
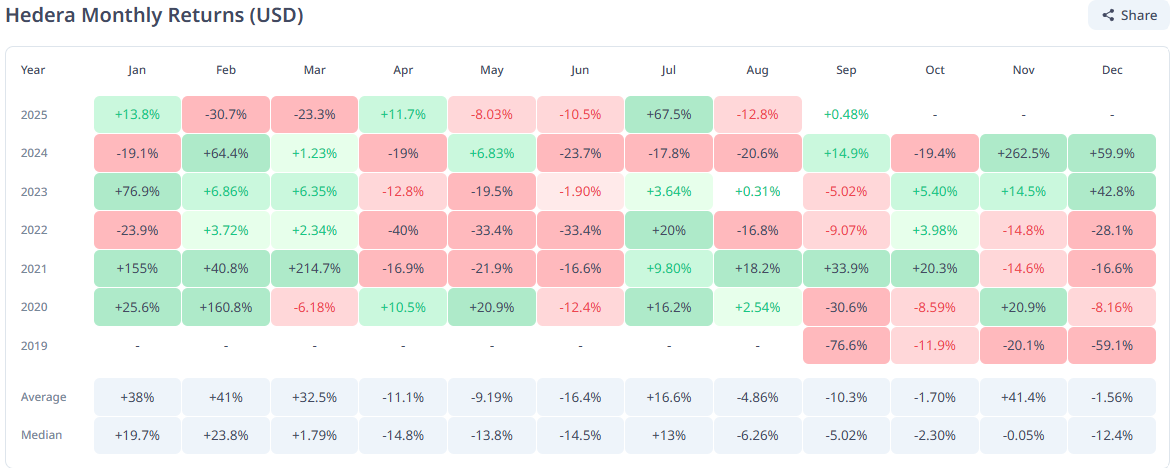 HBAR Monthly Returns Historical. Source: CryptoRank
If inflow returns and investor sentiment improves, HBAR could bounce back to reclaim the $0.230 support. Holding this level would be crucial for triggering recovery. A complete reversal would require the token to climb toward $0.271 or higher, signaling renewed strength after months of bearish market activity.


추천 콘텐츠
Real Integrates iExec to Advance Privacy-Focused RWA Infrastructure

BNB slips below $590 as Trump threatens to strike Iranian power plants

Bitcoin Miners Warn No Bottom Yet, CryptoQuant Says—What On-Chain Metrics Reveal


인기 뉴스
더보기
