Top 3 Price Prediction: Bitcoin, Ethereum, Ripple – BTC, ETH, and XRP dips as US involvement in Israel-Iran conflict looms
- Bitcoin trades around $104,000 on Wednesday, down 2% from Tuesday, as geopolitical tensions continue to weigh on the market.
- Ethereum is nearing its lower consolidation boundary of $2,461; a close below this level would indicate a correction ahead.
- XRP faces rejection from its 50-day EMA at $2.24, increasing the likelihood of a short-term correction.
Bitcoin (BTC), Ethereum (ETH) and Ripple (XRP) prices hovered around key levels on Wednesday after falling the previous day. The crypto market turned risk-averse amid growing concerns that the United States could intervene in the escalating conflict between Israel and Iran. These rising geopolitical conflicts could trigger a risk-off sentiment in the market, signaling the potential for further downside across major digital assets.
Bitcoin could dip further if it closes below its 50-day EMA
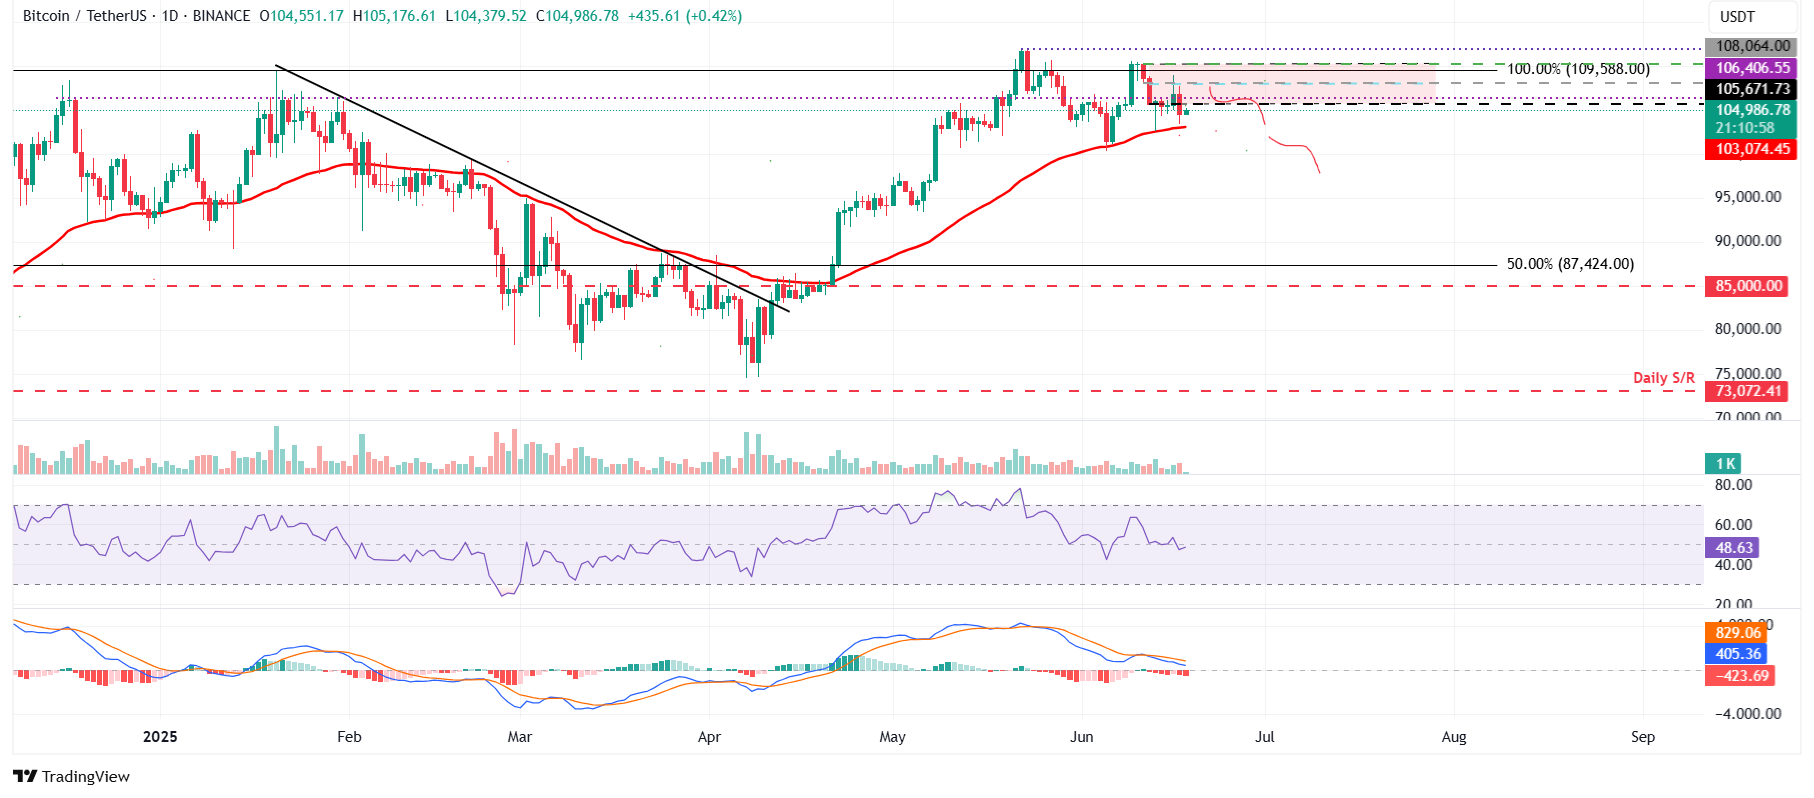
Bitcoin price declined sharply, falling from the June 10 open of $110,274 to the June 11 close of $105,671, creating a Fair Value Gap (FVG) at approximately $108,064. This bearish FVG marks a key resistance zone, meaning that once Bitcoin collects liquidity, it is likely to continue its correction.
On Monday, BTC retested and faced a slight pullback from this FGV zone, closing the day up by 1.14%. However, it declined by 2.10% the next day and retested its 50-day Exponential Moving Average (EMA) around $103,070. At the time of writing on Wednesday, it hovers at around $105,000.
If BTC continues its correction and closes below the 50-day EMA at $103,070 on a daily basis, it could extend the decline to retest its key psychologically important level at $100,000.
The Relative Strength Index (RSI) momentum indicator on the daily chart has slipped below its neutral level of 50, indicating bearish momentum. The Moving Average Convergence Divergence (MACD) indicator on the daily chart displayed a bearish crossover last week. It also shows a rising red histogram bar below its neutral level, indicating bearish momentum and giving credence to the downward trend.
BTC/USDT daily chart
On the contrary, if BTC recovers and closes above its FVG level at $108,064, it could extend the recovery toward retesting its May 22 all-time high of $111,980.
Ethereum could face a downleg if it closes below key support
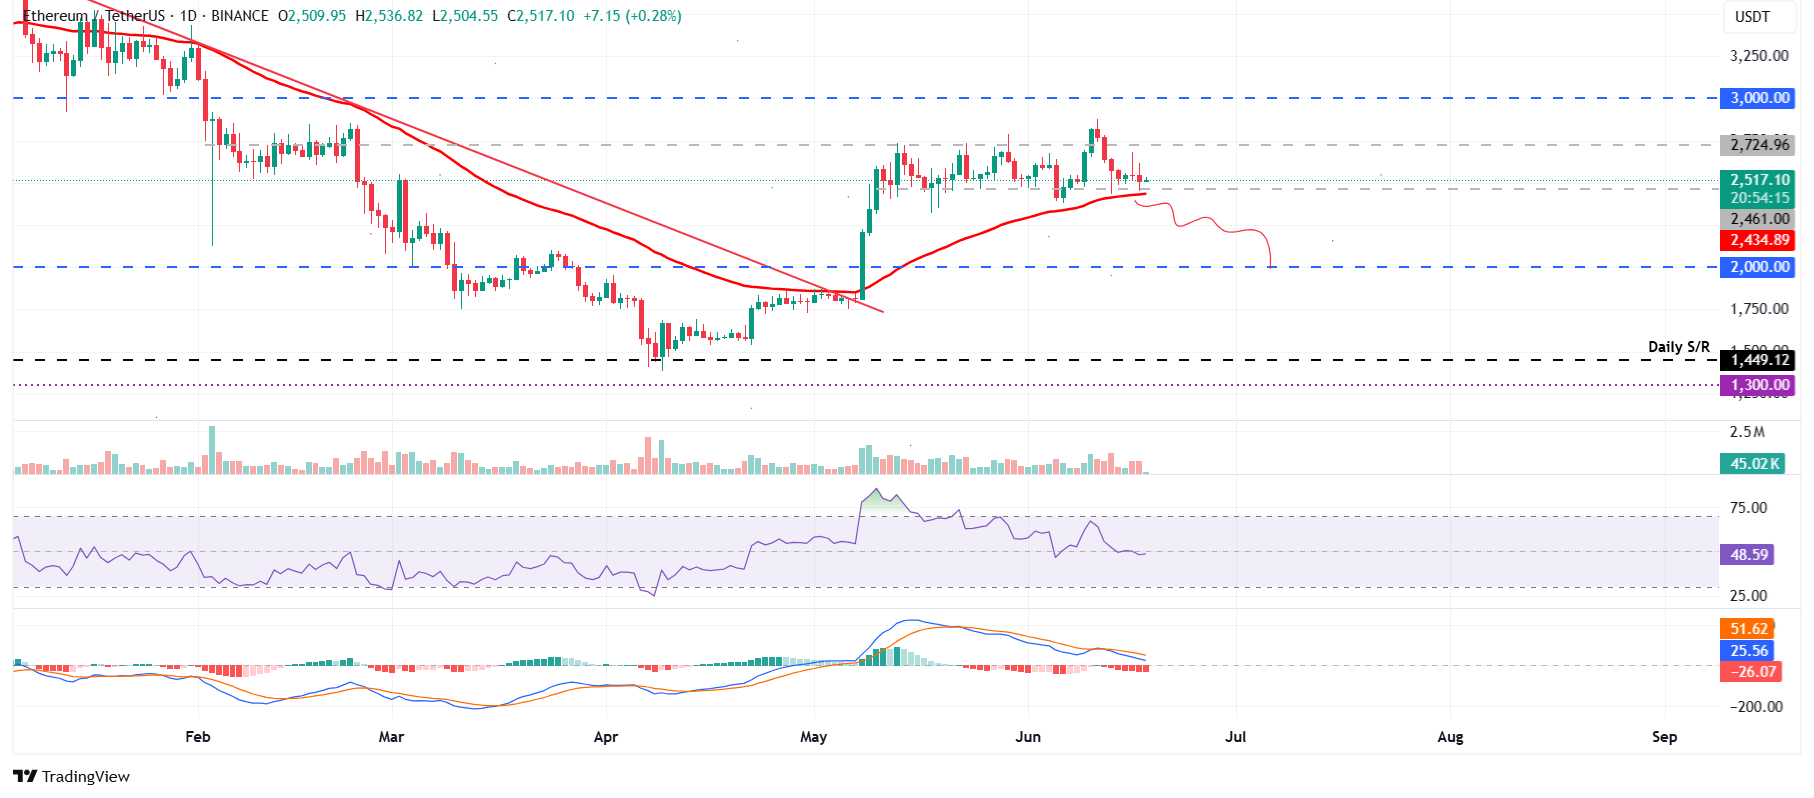
Ethereum price failed to find support around the upper consolidation level of $2,724 on June 12 and declined by 8.69% until Saturday. However, ETH hovered above its lower consolidation boundary of $2,461 the next day. On Monday, it attempted to retest but was rejected around its upper consolidation level and declined toward its 50-day EMA at $2,434 the next day. At the time of writing on Wednesday, it hovers at around $2,500.
If ETH continues its pullback and closes below its 50-day EMA at $2,434, it could extend the decline to retest its next support level at $2,000.
The RSI on the daily chart has slipped below its neutral level of 50, indicating bearish momentum. The MACD indicator on the daily chart displayed a bearish crossover last week. It also shows a rising red histogram bar below its neutral level, indicating bearish momentum and suggesting a downward trend.
ETH/USDT daily chart
On the other hand, if ETH finds support around its lower consolidation boundary at $2,461, it could extend the recovery to retest its upper consolidation boundary at $2,724.
XRP is poised for a downleg below its 50-day EMA
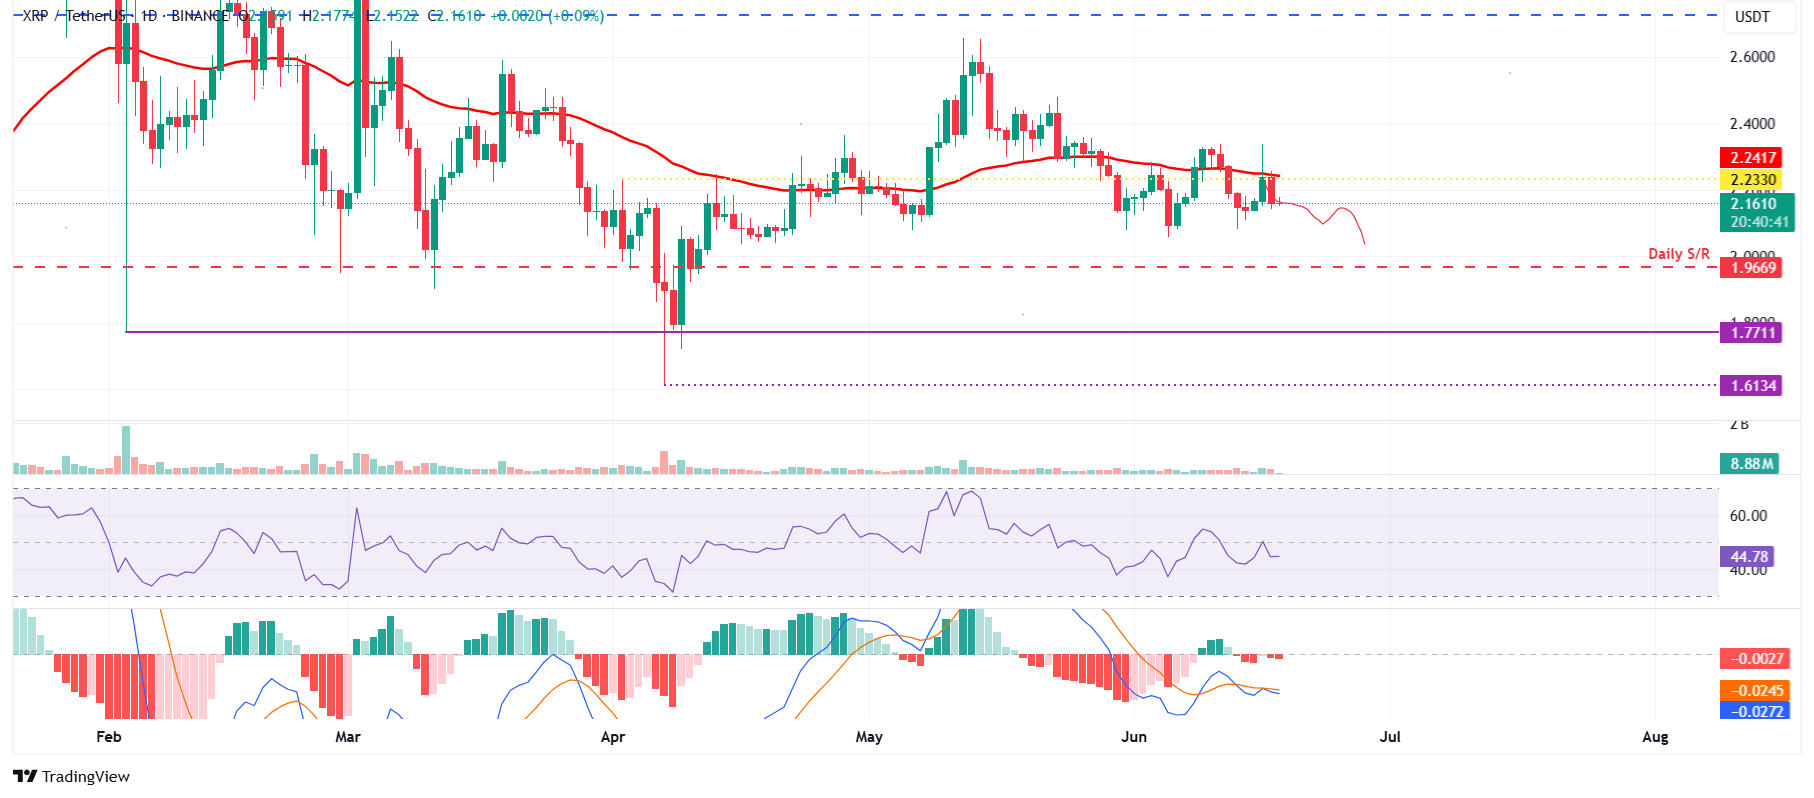
XRP price attempted to close above the 50-day EMA at $2.24 on Monday but failed, subsequently declining by 3.53% the following day. At the time of writing on Wednesday, it trades at around $2.16.
If XRP continues its correction, it could extend the decline to retest its next daily support level at $1.96.
The RSI on the daily chart reads 44, below its neutral level and points downward, indicating strong bearish momentum. Moreover, the MACD indicator on the daily chart displayed a bearish crossover, signaling a sell and indicating a downward trend.
XRP/USDT daily chart
However, if XRP recovers, it could extend to retest its 50-day EMA at $2.25.
Bitcoin, altcoins, stablecoins FAQs
Bitcoin is the largest cryptocurrency by market capitalization, a virtual currency designed to serve as money. This form of payment cannot be controlled by any one person, group, or entity, which eliminates the need for third-party participation during financial transactions.
Altcoins are any cryptocurrency apart from Bitcoin, but some also regard Ethereum as a non-altcoin because it is from these two cryptocurrencies that forking happens. If this is true, then Litecoin is the first altcoin, forked from the Bitcoin protocol and, therefore, an “improved” version of it.
Stablecoins are cryptocurrencies designed to have a stable price, with their value backed by a reserve of the asset it represents. To achieve this, the value of any one stablecoin is pegged to a commodity or financial instrument, such as the US Dollar (USD), with its supply regulated by an algorithm or demand. The main goal of stablecoins is to provide an on/off-ramp for investors willing to trade and invest in cryptocurrencies. Stablecoins also allow investors to store value since cryptocurrencies, in general, are subject to volatility.
Bitcoin dominance is the ratio of Bitcoin's market capitalization to the total market capitalization of all cryptocurrencies combined. It provides a clear picture of Bitcoin’s interest among investors. A high BTC dominance typically happens before and during a bull run, in which investors resort to investing in relatively stable and high market capitalization cryptocurrency like Bitcoin. A drop in BTC dominance usually means that investors are moving their capital and/or profits to altcoins in a quest for higher returns, which usually triggers an explosion of altcoin rallies.


추천 콘텐츠

Not a loophole: Singapore AI export controls let China tap US AI legally
CME Group to launch Solana and XRP futures options in October

Bitcoin, Gold, and U.S. Stocks Dive as Trump Pledges to Hit Iran ‘Extremely Hard’


인기 뉴스
더보기