Brent Crude Hovers Near $78: Strait of Hormuz Bottlenecks Clash With Macro Demand Resets
Global energy benchmarks are locked in an intense structural tug-of-war following an explosive breakdown of Middle East diplomatic agreements. After bottoming near multi-month consolidation bases earlier in the quarter, Brent crude futures executed a violent volatility pivot on July 8, 2026, registering a massive 5.20% single-day expansion, its most aggressive green session since May.
By Thursday, July 9, 2026, the spot contract neutralized its vertical momentum, flattening to trade inside a compact interval near $78.35 per barrel.
The massive volume surge across the front-month tape marks a direct repricing of international maritime supply lines. Direct military exchanges between United States naval elements and Iranian coastal infrastructure have officially terminated prior stabilization agreements, placing the Strait of Hormuz back at the absolute center of macro oil risk premiums.
However, the subsequent flattening of the price trajectory indicates that broader macroeconomic headwinds and automated sector rotations are actively checking the upside parameters of the energy complex.
Global Energy & Precious Metals Baseline Indicators
| Energy Metric / Benchmark | Real-Time Settlement Range, July 9, 2026 | 48-Hour Historical Shift |
|---|---|---|
| Brent crude futures | ~$78.35 / bbl | Held steady, +0.43%, after a +5.20% spike |
| WTI crude futures | ~$73.74 / bbl | Correlated consolidation, +0.31% |
| 52-week Brent horizon | $58.72–$126.41 | Normalized off structural April cycle tops |
| EIA Q3 2026 price baseline | $74.00 / bbl average projection | Revised downward from prior $95 target models |
| Spot gold, XAU/USD | ~$4,117.20 / oz | Rebounding, +1.03%, on sticky macro inflation data |
The Catalyst: The Geopolitical Chokepoint Premium Returns
The immediate momentum shift in global oil prices was triggered by a rapid, un-sandboxed escalation in the Persian Gulf. Following targeted drone and missile strikes against premium commercial tankers navigating the outskirts of the Gulf of Oman, the White House officially dissolved the June interim ceasefire agreements and revoked active sanctions exemptions previously permitting managed Iranian crude exports.
The resulting kinetic counter-strikes executed by US CENTCOM units against coastal missile assets generated an immediate wave of risk-premium expansion.
This structural friction went live across shipping infrastructure instantly: global marine insurance consortiums adjusted war-risk surcharges upward, and vessel tracking metrics mapped a sharp deceleration in commercial transit through the narrowest vectors of the Strait of Hormuz.
Because approximately 20% of the world’s liquid petroleum supply relies exclusively on this chokepoint channel, the physical risk of localized logistics asset lockups forced short-sellers to aggressively cover exposure. That drove the front-month contract briefly above the psychological $80 threshold before settling into the current $78 band.
The Resistance Layer: Why Paper Markets Are Shaking Off the War Shock
Despite the clear structural threats to Middle East shipping lines, Brent crude futures have notably failed to re-test the premium $90 to $95 price marks recorded during the initial cycle peaks of early spring.
This relative containment reveals that paper derivative markets are pricing in deep macroeconomic demand adjustments for the second half of 2026.
The first friction stems from the U.S. Energy Information Administration’s mid-year statistical adjustments. The EIA’s updated Short-Term Energy Outlook drastically scaled back its structural Q3 2026 Brent projection models to an average baseline of $74 per barrel.
This downward revision tracks a permanent acceleration in non-OPEC+ supply curves, specifically driven by surging domestic production footprints across the United States, averaging 13.8 million barrels per day, and expanding logistics extraction networks in Latin America.
At the same time, a massive capital reallocation sequence is unfolding across broader financial markets. Institutional asset managers are shifting portfolio weights out of extended inflation proxies into core equities following severe post-earnings corrections inside the high-tech and semiconductor sectors.
As momentum-driven quantitative algorithms close out long commodity vectors to fulfill margin requirements or lock in defensive capital positions, mechanical sell-side flows are effectively diluting geopolitical supply premiums. That is checking oil’s ability to print clean, non-correlated breakouts.
What Energy and Freight Allocators Usually Miss
While retail tracking platforms focus entirely on the physical counting of stranded supertankers south of Oman, professional energy desks are closely auditing the structural decoupling of transponder data.
Real-time satellite registries indicate that while visible commercial transits through the Omani corridor have slowed significantly, an expanding volume of physical oil continues to pass through the chokepoint via “dark fleets” operating with localized tracking arrays completely deactivated.
Because these massive physical oil volumes continue to bypass kinetic assets and reach importing refining hubs in Asia, the real-world physical supply deficit is substantially less severe than public maritime alerts imply.
This invisible insulation warns active portfolios that the current geopolitical price pop relies heavily on short-term sentiment rather than an absolute depletion of physical refinery feedstocks.
The Tactical Trading Roadmap: Navigating the $78 Consolidation Shelf
For directional derivative parameters or cross-commodity hedging allocations, Brent’s forward structure has entered a high-probability range-bound regime bounded by two strict macro levels.
The geopolitical acceleration case, breakout past $80.50: If subsequent combat exchanges result in verified, permanent damage to fixed regional pipeline arrays or commercial port terminals, the localized shipping freeze will harden. A clean daily closing breakout above the local $80.59 chart peak would activate systematic trend-following CTA buying programs, unlocking a direct technical corridor back toward legacy structural value areas near $82.20 and $85.40.
The macro inventory reset case, breakdown below $75.40: If diplomatic backchannels successfully isolate the current maritime engagements to a short-term punitive cycle, the market will instantly return its focus to rising OECD commercial inventories. A structural failure to defend the recent $75.44 local low would signal that paper liquidation has completely overrun the conflict premium, exposing a swift mean-reversion vector back toward the EIA’s central support baseline near $71.00 to $72.00.
The disciplined execution framework requires keeping baseline position sizing modest. Buying into vertical geopolitical price spikes when the underlying physical dark flows remain intact introduces severe execution friction.
Risk Warning
Crude oil futures and global energy derivatives carry immense capital exposure, rapid margin requirements, and deep vulnerability to unverified geopolitical alerts and sudden algorithmic liquidations.
Energy assets are highly sensitive to global inventory build-outs, shifts in central bank interest-rate frameworks, and maritime insurance adjustments. Portfolios must implement precise stop-loss thresholds and employ strict capital conservation boundaries before maintaining overnight unhedged risk exposure.

Popular Articles
View More
Rate Hike Lands, BTC Hits 8-Month High — Bad News Priced In or a Short-Squeeze Rally? | MEXC Alpha Trader Weekly Research
Week 3 of September 2026 Statistics Period: September 16 – September 22, 2026 Data Cutoff: September 22, 2026 Core Narrative Over the past week, crypto markets moved through a full cycle of

MEXC On-Chain Daily Report: SoFi Uses Stablecoin Settlement for Mastercard Transactions, Annualized Volume Expected to Exceed $25 Billion
Updated: September 23, 2026, 09:30 (UTC+8) | Author: MEXC Headlines Ondo Stocks launches on NEAR, with TVL exceeding $1 billion CFTC says markets must prepare for large-scale tokenization Circle’s

Nvidia Stock Price Prediction: Is the AI Boom Now Eating Nvidia's Own Profit?
Nvidia just held its gross margin near 75% for a third straight quarter. In the same press release, it guided that number down. Revenue is still accelerating — $96.2 billion in the quarter ended July

Hot Crypto Updates
View More
Are Bitcoin Holders Taking Profit? SOPR & Realized Profit Explained
Overview On-chain realized profit reached roughly $1.03 billion in a single day on October 8, the second-highest daily figure of 2026 and only narrowly below the year's $1.04 billion peak. According

Bitcoin, Stocks, and Other Assets Are Falling. What Is Driving the Sell-Off?
Bitcoin extended its decline as selling pressure spread across Indonesian and global equities. According to an MEXC price-page snapshot updated at 17:43 WIB on October 8, BTC traded near

Ledger Hack Explained: Hardware Implant Found in CryptoBilis-Sold Wallet as Losses Near $93 Million, and How to Protect Your Device
Key Takeaways Ledger confirmed on Saturday, October 10, 2026, that "one of the impacted users' devices contained an unauthorized hardware implant," after buyers who purchased devices from Southeast

Trending News
View More
SpaceX Options Surge: Turning IPO Momentum Into a Volatility Test
SpaceX’s post-IPO rally has evolved beyond a simple first-day demand story. After pricing its shares at $135, opening near $150, and quickly surging past the $200 threshold, the market is now entering
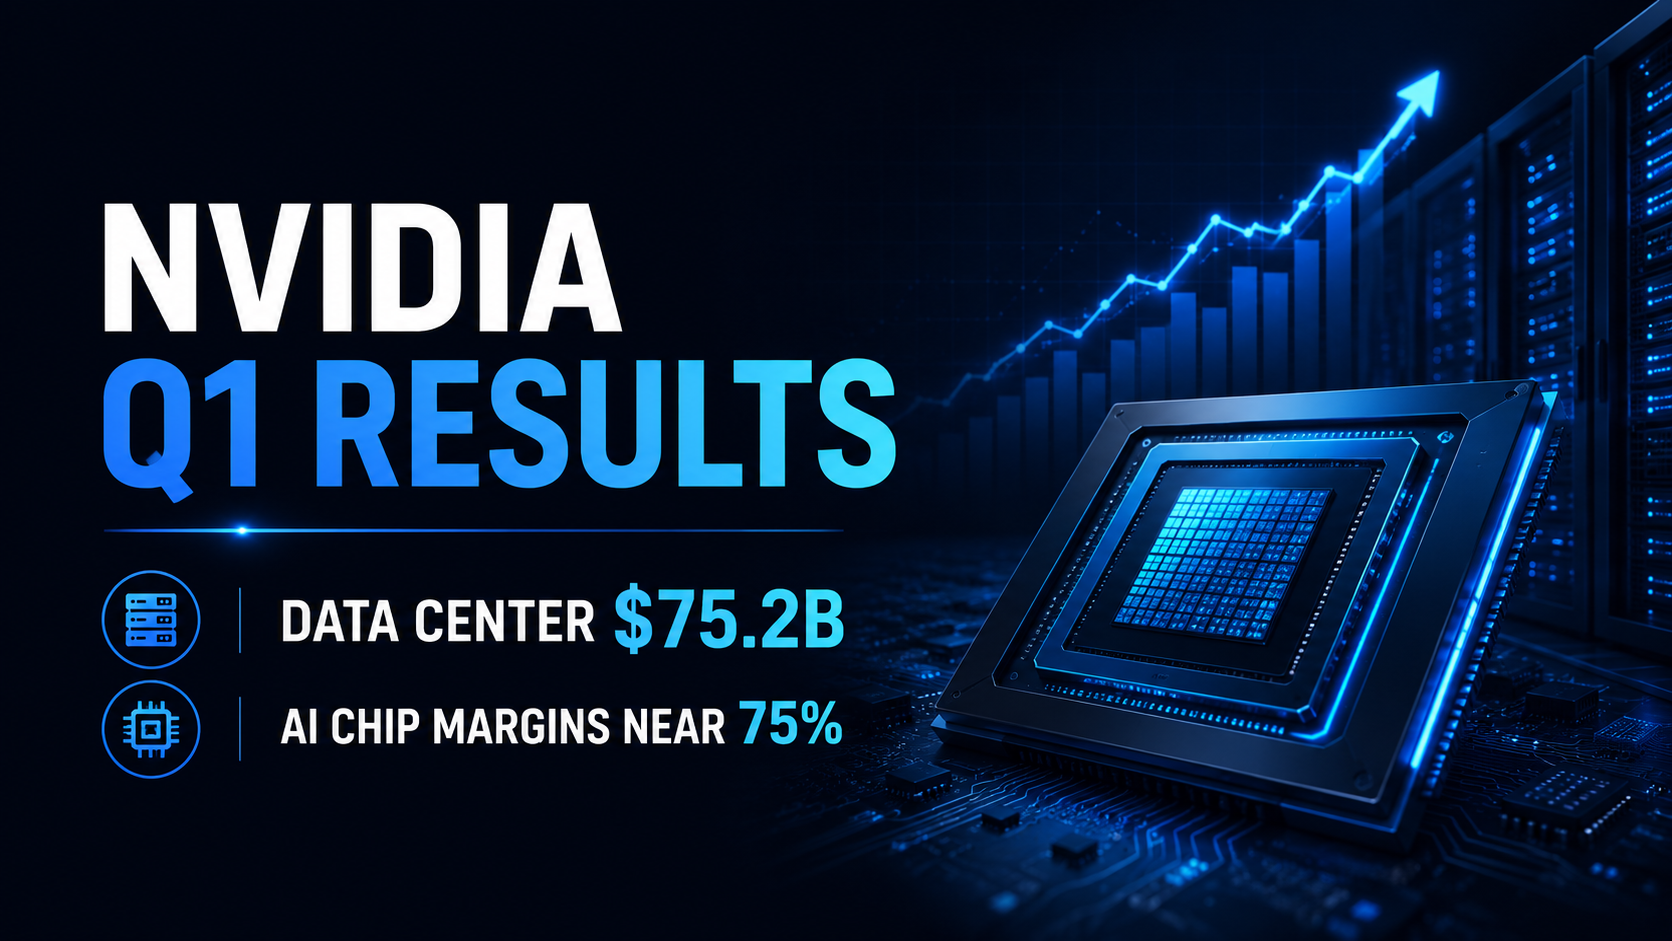
Nvidia FY2027 Q1 Earnings Review: Data Center Revenue Hits $75.2B as AI Chip Margins Hold Near 75%
Nvidia reported its fiscal 2027 first-quarter financial results on May 20, 2026, delivering an absolute powerhouse of a quarter. For the period ending April 26, 2026, the chip giant pulled in a record


Related Articles
View More
MEXC On-Chain Daily Report: USDC Becomes the First Significant E-Money Token Under MiCA
Updated: October 15, 2026, 09:30 (UTC+8)|Author: MEXCHeadlinesUSDC designated the first significant e-money token under MiCASEC approves Cboe binary options tied to key corporate metricsARK Ventur

MEXC On-Chain Daily Report: Solana Alpenglow Confirmed for October 21 Launch
Updated: October 14, 2026, 09:30 (UTC+8)|Author: MEXCHeadlinesSolana Alpenglow confirmed for October 21 launchSui completes native post-quantum signature transaction testSberbank plans to open cry

MEXC On-Chain Daily Report: Hong Kong to List Its Second Spot Solana ETF on October 13
Updated: October 13, 2026, 09:30 (UTC+8) | Author: MEXCHeadlinesThree major firms’ stablecoin acquisitions exceed $3 billionStandard Chartered launches institutional RLUSD custody serviceFASB prop