Ethereum has gone from a $0.31 ICO token to one of the most closely watched assets in global finance. Its price history isn't just a chart — it's a record of every major shift in the crypto market,Ethereum has gone from a $0.31 ICO token to one of the most closely watched assets in global finance. Its price history isn't just a chart — it's a record of every major shift in the crypto market,
Learn/Cryptocurrency Knowledge/Hot Concepts/Ethereum Pr...h Explained

Ethereum Price History by Year: Every Major Bull Run and Crash Explained

Intermediate
Apr 22, 2026James Mitchell
0m
Major
MAJOR$0.05064-5.62%
Bull
BULL$0.002506-7.69%
ERA
ERA$0.1105-8.45%


Ethereum has gone from a $0.31 ICO token to one of the most closely watched assets in global finance.
Its price history isn't just a chart — it's a record of every major shift in the crypto market, from the ICO boom to DeFi, from brutal crashes to institutional adoption.
This guide walks you through the full Ethereum price history by year, what drove each move, and what long-term investors can actually learn from it.

Key Takeaways
  • Ethereum launched in July 2015 at a price of roughly $0.311, following a 2014 ICO that raised $18.3 million.
  • The 2017 ICO boom drove ETH from around $8 to a yearly high near $882, marking its first major bull run.
  • The DeFi and NFT explosion pushed ETH to an all-time high of approximately $4,891 in November 2021.
  • The Merge on September 15, 2022 transitioned Ethereum to proof-of-stake, cutting energy consumption by over 99%.
  • The SEC approved spot Ethereum ETFs in May 2024, opening the door to institutional capital and fueling a new price rally.
  • ETH reached a new all-time high near $4,954 in August 2025, surpassing its 2021 record for the first time in nearly four years.

Ethereum Price History From Launch: The ICO Era and the First Bull Run

Ethereum was born as an idea in a 2013 whitepaper by Vitalik Buterin.
In the summer of 2014, the project raised $18.3 million through a public ICO, selling ETH at roughly $0.311 per token — a price that would look almost unbelievable in hindsight.
When trading began in August 2015, ETH opened at approximately $2.92 before falling to a low near $0.44 in October of that year, according to CoinLore historical data.
The story changed fast in 2017.
The network gained major attention when Initial Coin Offerings built on Ethereum raised billions of dollars for blockchain projects.
That ICO frenzy sent ETH surging from around $8 at the start of that year to a yearly high near $882, closing out its best calendar year on record according to CoinLore data.
The momentum carried into early 2018, with ETH climbing to approximately $1,400 before a prolonged correction wiped out most of those gains.


Ethereum Price History From the DeFi Boom to the NFT All-Time High

The period from mid-2020 through late 2021 was arguably the most explosive chapter in the Ethereum price history chart.
DeFi — decentralized finance — became a mainstream concept almost overnight.
Lending protocols, decentralized exchanges, and yield farming platforms all ran on Ethereum, and the surge in on-chain activity drove demand for ETH to pay transaction fees.
The Beacon Chain launched in December 2020, introducing the Proof of Stake consensus layer that would eventually replace mining.
That structural upgrade added more confidence to an already bullish market.
Then came the NFT boom of 2021.
Ethereum hit the news when a digital art piece was sold as one of the most expensive NFTs ever recorded, fetching approximately 69.3 million U.S. dollars.
Gas fees skyrocketed as demand overwhelmed network capacity, and ETH's price followed.
By November 2021, ETH reached approximately $4,891 — its all-time high at that point, according to CoinGecko data.
The Ethereum all time high price history up to that moment reflected just how much the world had started to bet on smart contract infrastructure.


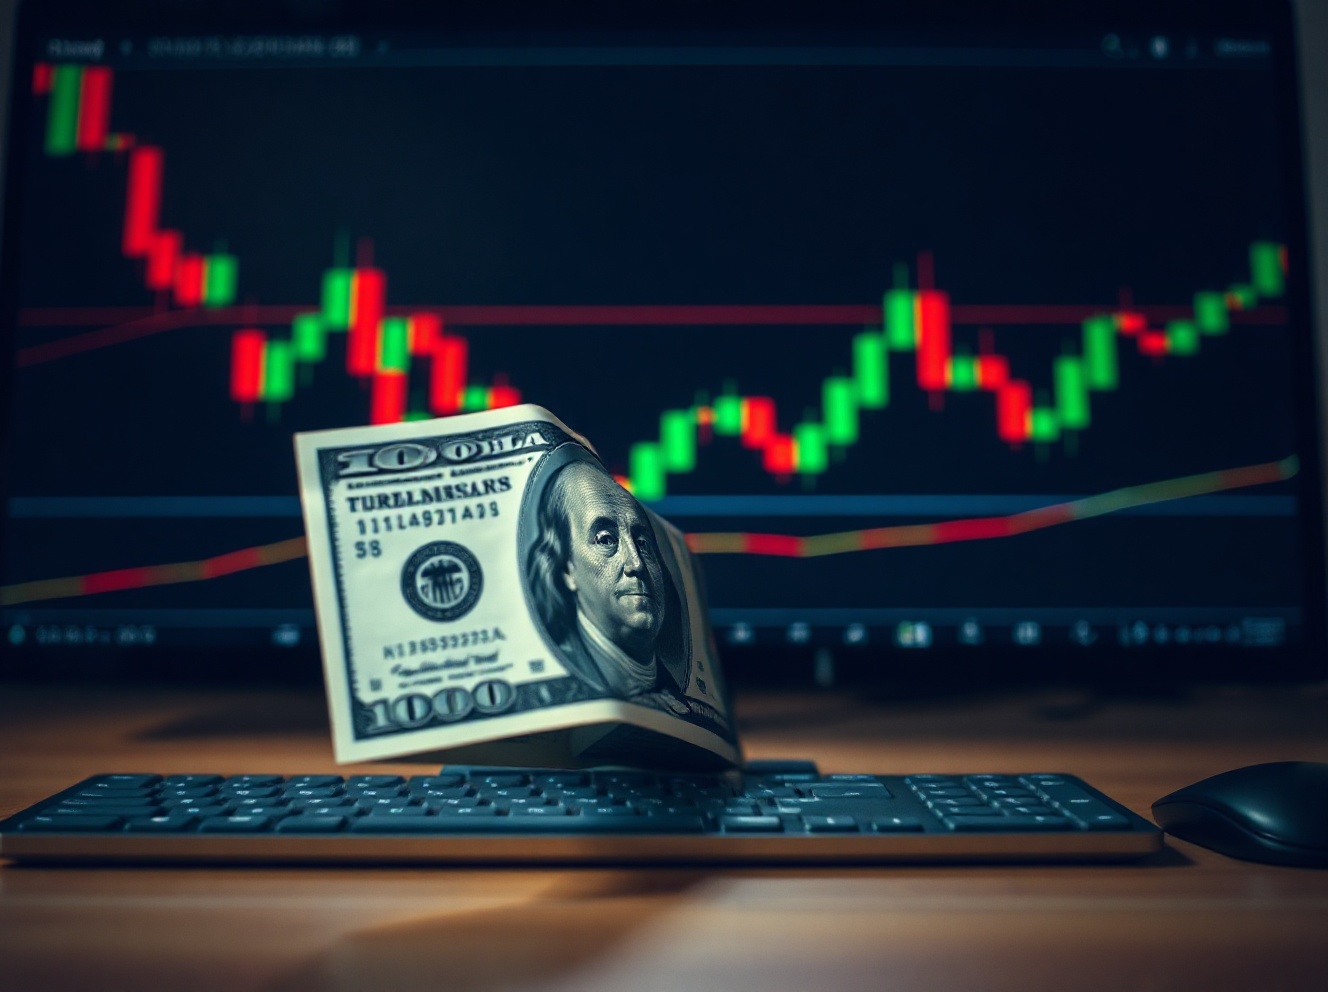
The 2022 Crash, The Merge, and the Road to Recovery

After the highs of 2021, the market turned.
Rising interest rates, tightening macro conditions, and a string of high-profile collapses shook investor confidence across the board.
ETH dropped from its peak above $4,800 all the way down to roughly $880 by mid-2022 — a drawdown of over 80%.
The collapse of the FTX exchange in November 2022 made things worse, triggering a fresh wave of selling that left the entire market rattled.
But one of the most significant events of this period wasn't a price move — it was a technology milestone.
The Merge went live on September 15, 2022, transitioning Ethereum from proof-of-work to proof-of-stake and reducing ETH issuance by approximately 90%.
Following The Merge, Ethereum reduced its energy consumption by over 99%.
The Ethereum price history 2022 ended on a bruised note, but the network itself had quietly become more efficient, more sustainable, and structurally deflationary in terms of supply issuance.
By 2023, prices began stabilizing and slowly recovering as confidence returned to the broader crypto market.


Ethereum's Recent Price Surge and the Spot ETF Era

The shift into a new market cycle started taking shape in 2024.
In January 2024, the SEC approved spot Bitcoin ETFs — and institutional appetite for regulated crypto exposure was clearly there.
The SEC approved spot Ethereum ETFs for listing and trading in May 2024, with the funds beginning to trade on July 23, 2024.
This was a landmark moment for the Ethereum price history chart.
For the first time, everyday investors could get ETH exposure through standard brokerage accounts, and institutional money began flowing in at scale.
The rally that followed pushed ETH to a new all-time high of approximately $4,954 in August 2025, according to CoinGecko data — surpassing the 2021 record for the first time in nearly four years.
Looking at the ethereum price history over the last 5 years, ETH moved from roughly $130 in early 2020 to a peak above $4,900 in August of that year — though prices have since pulled back significantly from that high.
As of the time of writing, ETH has pulled back significantly from that peak — you can check the latest price on MEXC for real-time data.
You can track the live ETH price and full Ethereum price history data on MEXC.


Frequently Asked Questions

What is the all-time high price of Ethereum?
According to CoinGecko data, Ethereum reached its all-time high of approximately $4,954 in August 2025.


What was Ethereum's price at launch?
Ethereum's ICO price in 2014 was approximately $0.311 per ETH, according to CoinMarketCap.


What is the all-time low price of Ethereum?
Ethereum's recorded all-time low was approximately $0.44 in October 2015, shortly after its mainnet launched, based on CoinLore historical data.


How has Ethereum's price changed over the last 5 years?
ETH moved from roughly $130 in early 2020 to an all-time high near $4,954 in August 2025, though it has since pulled back substantially.


How does Ethereum's price history compare to Bitcoin?
Both assets follow similar broad market cycles, but ETH tends to show larger percentage swings in both directions — more explosive in bull markets, and sharper drawdowns during corrections.


What caused the Ethereum price crash in 2022?
A combination of rising interest rates, the collapse of the FTX exchange in November 2022, and broader crypto market deleveraging drove ETH down over 80% from its 2021 high.


Conclusion

The Ethereum price history by year tells one consistent story: this is a high-conviction, high-volatility asset.
Every major price surge has been tied to a real catalyst — the ICO boom, DeFi adoption, NFT demand, institutional ETF access.
And every major crash has been followed, eventually, by a recovery to new highs.
That pattern doesn't guarantee future outcomes, but it does suggest that understanding the history matters before making any investment decision.
If you want to explore Ethereum's current price or start trading ETH, MEXC offers access to real-time price data and trading tools.
  • Past cycles inform the next — see our full Ethereum guide for the fundamentals beneath the chart.

Market Opportunity
Major Logo
Major Price(MAJOR)
$0.05064
$0.05064$0.05064
-2.44%
USD
Major (MAJOR) Live Price Chart

Popular Articles

View More
Why Is XRP Dropping? 4 Key Reasons Behind the Price Down

Why Is XRP Dropping? 4 Key Reasons Behind the Price Down

XRP has puzzled investors as its price continues falling despite major positive developments. While Ripple secured regulatory wins and launched spot ETFs, XRP trades near $1.46, down roughly 60% from

Sri Lanka vs Pakistan Scorecard 2026: Full Score, Result, Highlights and Points Table

Sri Lanka vs Pakistan Scorecard 2026: Full Score, Result, Highlights and Points Table

1.Key Takeaways Main keyword: Sri Lanka national cricket team vs Pakistan national cricket team match scorecard Match covered: Sri Lanka vs Pakistan, ICC Men’s T20 World Cup 2026, Super Eight Match

Crypto Tax in South Korea: New Proposed Rules & Rates Update

Crypto Tax in South Korea: New Proposed Rules & Rates Update

Key Takeaways: 22% combined tax rate on virtual asset capital gains. 2.5 million KRW annual tax-free profit threshold. Implementation officially delayed until January 1, 2027. NTS blockchain tracking

Is Bitcoin a Bubble? History, Warning Signals, and What the Data Shows

Is Bitcoin a Bubble? History, Warning Signals, and What the Data Shows

Bitcoin has been called a bubble more times than most people can count — yet it has survived every crash and gone on to set new all-time highs. So is Bitcoin a bubble, or is it something

Hot Crypto Updates

View More
Iran Conflict and Oil Prices: Where Is Crude Headed Next?

Iran Conflict and Oil Prices: Where Is Crude Headed Next?

The Iran conflict has triggered the largest oil supply shock in history, sending Brent crude to $138/bbl. Here's what the EIA, Goldman Sachs, and major analysts predict — and what it means for your

BEEG Listing Time: Realistic 2026 CEX Timeline Revealed

BEEG Listing Time: Realistic 2026 CEX Timeline Revealed

When will BEEG Blue Whale hit a major CEX in 2026? We break down the real listing criteria, where BEEG stands today, and which exchange window actually makes sense — before the announcement drops.

BEEG 2026 Risk Analysis: 5 Factors That Could Trigger a Major Pullback

BEEG 2026 Risk Analysis: 5 Factors That Could Trigger a Major Pullback

What could trigger a major pullback for BEEG Blue Whale in 2026? This deep-dive risk analysis covers five structural and macro-level threats — from razor-thin liquidity to Sui ecosystem concentration

What is Market Correlation in Cryptocurrency?

What is Market Correlation in Cryptocurrency?

Market correlation in cryptocurrency refers to the statistical measure of how two or more digital assets move in relation to each other. Understanding this relationship is crucial for portfolio

Trending News

View More
Cardano (ADA) Founder Charles Hoskinson Makes Strong Statements Amid Major Drop

Cardano (ADA) Founder Charles Hoskinson Makes Strong Statements Amid Major Drop

Cardano (ADA) founder Charles Hoskinson, in a statement, assessed the future of the cryptocurrency sector. Continue Reading: Cardano (ADA) Founder Charles Hoskinson

US Dollar Rises After Strong JOLTS Data; Labor Market Reports in Focus

US Dollar Rises After Strong JOLTS Data; Labor Market Reports in Focus

BitcoinWorld US Dollar Rises After Strong JOLTS Data; Labor Market Reports in Focus The US Dollar strengthened against major peers on Tuesday, extending its recent

Trump admin stuns by appointing convicted Jan. 6 rioter to major counterterrorism role

Trump admin stuns by appointing convicted Jan. 6 rioter to major counterterrorism role

President Donald Trump's administration stunned political analysts and observers on Tuesday by appointing a convicted Jan. 6 rioter to a key counterterrorism job

How To Avoid The Major Trap That Bitcoin Is Setting Up For Traders

How To Avoid The Major Trap That Bitcoin Is Setting Up For Traders

Bitcoin is entering another decisive period after spending recent months trading inside a higher-timeframe ascending range. Technical analysis of the daily chart

Related Articles

View More
Why Is XRP Dropping? 4 Key Reasons Behind the Price Down

Why Is XRP Dropping? 4 Key Reasons Behind the Price Down

XRP has puzzled investors as its price continues falling despite major positive developments.While Ripple secured regulatory wins and launched spot ETFs, XRP trades near $1.46, down roughly 60% from i

What Is a Bitcoin CFD? A Beginner's Guide to CFD Bitcoin Trading

What Is a Bitcoin CFD? A Beginner's Guide to CFD Bitcoin Trading

If you've been watching Bitcoin's price swings and wondering how to act on them — without actually buying BTC — Bitcoin CFD trading might be what you're looking for.A Bitcoin CFD lets you speculate on

Who Is Peter Schiff and Why Does He Hate Bitcoin So Much?

Who Is Peter Schiff and Why Does He Hate Bitcoin So Much?

If you've spent any time in crypto circles, you've almost certainly heard the name Peter Schiff — usually in the same sentence as a prediction that Bitcoin is about to collapse.Schiff is one of Wall S

Bitcoin Treasuries: Top Public Companies Holding BTC and Why It Matters

Bitcoin Treasuries: Top Public Companies Holding BTC and Why It Matters

Public companies are now holding more Bitcoin than ever — and the numbers are hard to ignore.According to CoinGecko, 167 institutions collectively hold over 1.8 million BTC, representing roughly 8.62%

Sign Up on MEXC
Sign Up & Receive Up to 10,000 USDT Bonus
RealStocks Now Live
RealStocks Now LiveRealStocks Now Live
Trade real U.S. stock via regulated brokerage