Ethereum Eyes Breakout As $1,400 to $1,800 Zone Sparks Bull Cycle Hopes Now
- ETH trades near $2,031, with support at $1,780–$1,850 and first resistance at $2,100–$2,150.
- Binance ETH/USDT long-short ratio is 2.1616, while OKX ETH accounts ratio stands at 2.33.
- ETH 24h liquidations hit $41.15M, including $31.08M longs and $10.07M shorts.
Ethereum is drawing fresh attention as traders focus on a support band between $1,400 and $1,800.
The range now sits at the center of new cycle talk across the market. However, price remains below key resistance, so traders are still waiting for a clear breakout.
Accumulation Zone Gains Attention
Market maps now place Ethereum’s strongest buying area between $1,400 and $1,800. Traders have described that band as the “best buying zone” on a wider cycle view.
Because price recently tested nearby support, the area is getting close attention. It also stands near the lower end of the present market structure.
The same map marks $4,700 as the main breakout level for this cycle. That price sits near Ethereum’s earlier peak and remains a clear resistance point. As a result, traders are linking any longer rally to a move above that barrier.
Until then, the larger trend stays capped by overhead supply. Still, support alone does not confirm a fresh bull trend. Buyers need to defend the lower band during weak sessions and sharp pullbacks.
A durable base usually forms through repeated tests and steady holding action. For now, the zone offers interest, but not certainty.
Daily Chart Holds in a Tight Range
On the daily chart, Ethereum still shows damage from the earlier triangle breakdown. The selloff pushed price from the low $3,000 range toward the $1,750 area. After that move, price stopped falling fast and shifted into sideways trading.
That change suggests sellers lost some momentum after the sharp drop. Ethereum now trades near $2,030, around the middle of that range. This often points to balance between buyers and sellers in the near term.
Mid-range trading can continue until new demand or selling pressure appears. Therefore, traders are watching the edges of the range more closely.
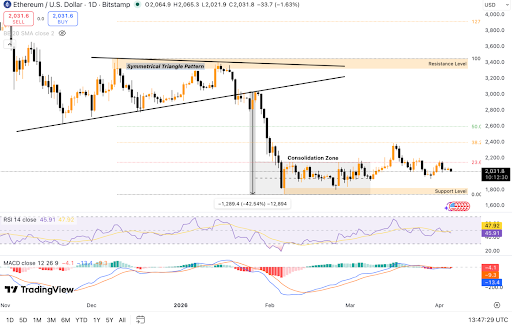 Ethereum trades sideways after triangle breakdown. Source: TradingView.
Momentum signals remain mixed at current levels. The RSI is near 46, while the MACD stays below the zero line. That setup keeps the broader tone soft, even as price holds steady. However, the MACD histogram is flattening, which may mean selling pressure is easing.
Long Bias Meets Liquidation Pressure
Exchange data shows that many traders still favor long positions on Ethereum. Binance ETH/USDT long-short accounts stand at 2.1616, while OKX accounts show 2.33. Binance top trader accounts also remain long at 2.3659.
These figures show that bullish sentiment is still present across large exchanges.
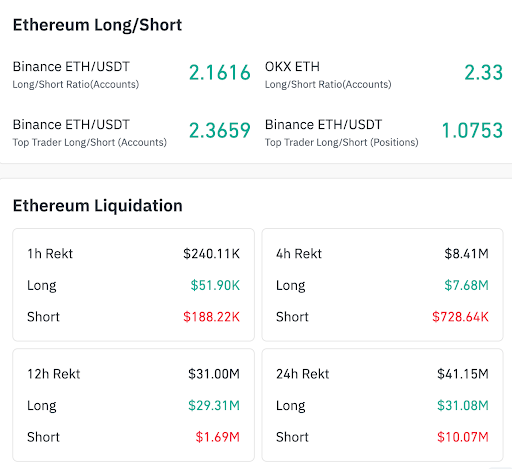 Ethereum longs dominate positioning; liquidations pressure buyers. Source: Coinglass.
However, top trader positions are closer to balance at 1.0753. That gap suggests sentiment is bullish, but larger sizing is more careful. In simple terms, traders expect upside, yet they are not fully aggressive. This split can appear when confidence is present, but price action stays uncertain.
Liquidation data tells a different short-term story. Over 12 hours, long liquidations reached $29.31 million, while shorts totaled $1.69 million. Over 24 hours, longs reached $31.08 million, compared with $10.07 million for shorts. So, leveraged buyers have faced more pressure during the recent move.
Breakout Hopes Rest on Key Levels
The main support zone sits between $1,780 and $1,850 on the daily chart. A break below that area could expose Ethereum to another test of lower support. So far, that band has helped keep the current range intact.
Because of that, it remains the first level many traders are tracking. On the upside, the first resistance stands near $2,100 to $2,150. A daily close above that zone could shift short-term sentiment.
After that, traders are watching $2,400 and $2,600 as the next targets. A stronger recovery would also need progress toward the $3,300 to $3,450 area. The broader market is still focused on the $4,700 resistance area.
Some cycle maps point to $10,000, $15,000, and $20,000 as future targets. For now, those levels remain secondary until price clears nearer barriers. Until price confirms strength, Ethereum remains in a wait-for-breakout phase.
The post Ethereum Eyes Breakout As $1,400 to $1,800 Zone Sparks Bull Cycle Hopes Now appeared first on Live Bitcoin News.


You May Also Like

Cathie Wood’s ARK Invest Buys $13.7M in Circle Shares While Selling Robinhood Stock

The changing face of elder care in Malaysia — Sayed Mohammad Reza Yamani Sayed Umar

Covéa Chooses Shift Technology as Strategic Partner for Fraud and Risk Management