On Wednesday, Bitcoin, the largest digital asset, experienced slight bearish pressure as news about the Federal Reserve (Fed) rate cut flooded the broader cryptocurrency sector. Even though BTC experienced price fluctuations, there was still a significant buying pressure observed among retail and institutional investors in the market. Market Bets On Bitcoin Are Heavily Heating Up […]On Wednesday, Bitcoin, the largest digital asset, experienced slight bearish pressure as news about the Federal Reserve (Fed) rate cut flooded the broader cryptocurrency sector. Even though BTC experienced price fluctuations, there was still a significant buying pressure observed among retail and institutional investors in the market. Market Bets On Bitcoin Are Heavily Heating Up […]

Bitcoin Accumulation Addresses Hit Record Inflows Before Fed Interest Rate Verdict, Another Major Rally Brewing?

On Wednesday, Bitcoin, the largest digital asset, experienced slight bearish pressure as news about the Federal Reserve (Fed) rate cut flooded the broader cryptocurrency sector. Even though BTC experienced price fluctuations, there was still a significant buying pressure observed among retail and institutional investors in the market.

Market Bets On Bitcoin Are Heavily Heating Up

Bitcoin’s renewed upward strength may have slowed down, but investors’ sentiment was not thwarted by the negative price action. CryptoQuant, a leading on-chain data analytics platform, has released a report indicating that buying pressure has experienced a significant surge despite a slight pullback in BTC’s price.

In the quick-take post, Burak Kesmeci, a market expert, highlighted that Bitcoin is witnessing a sharp surge of inflows into accumulation addresses. These accumulation addresses, which are frequently regarded as powerful players in the market, are consuming huge quantities of BTC even in the face of persistent macroeconomic uncertainty.

According to the report, this powerful wave of accumulation was identified prior to the United States Federal Reserve’s interest rate decision. Such a buying spree ahead of the Fed’s decision suggests that market players are acting strategically by choosing to stack more BTC in anticipation of increased volatility and possible macroeconomic changes.

Bitcoin

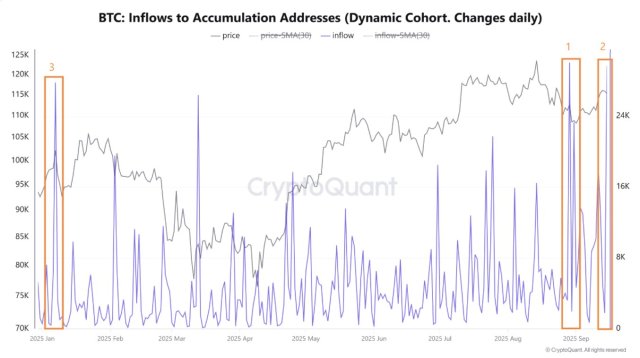
Burak Kesmeci noted that over 29,685 BTC were seen flowing into accumulation addresses just hours before the Fed’s rate decision. Data shared by the expert reveals that the massive inflows mark the second-largest single-day inflow of 2025. With long-term holders placing themselves ahead of potential catalysts that could define the next phase of the market cycle, this pattern is indicative of growing confidence in Bitcoin’s resiliency.

Following this buying spree by key investors, the total amount of BTC held in accumulation addresses has now reached approximately 2.84 million BTC. At the same time, the average realized price cost basis of these addresses has increased to $72,437 per BTC.

A Rapid Buying In The Option Market

The ongoing buying pressure currently observed around Bitcoin is also displayed in other key metrics. In a recent post on the X platform, Glassnode, a financial and on-chain platform, reported that the Bitcoin options market is booming as traders scramble to get positions.

Glassnode revealed this wave of fresh optimism after examining the BTC Options Net Premium Strike Heatmap. BTC’s buying pressure comes as the flagship asset gains traction, with its price only 6.8% away from its all-time high, heading into the most anticipated FOMC meeting of this cycle.

In the meantime, Glassnode highlighted that options traders are rapidly buying options in order to protect or position themselves for a volatility spike. This trend reflects the uncertainty of the market and the anticipation of a major move in the future.

Bitcoin
Market Opportunity
Bitcoin Logo
Bitcoin Price(BTC)
$89,583.27
$89,583.27$89,583.27
-1.20%
USD
Bitcoin (BTC) Live Price Chart
Disclaimer: The articles reposted on this site are sourced from public platforms and are provided for informational purposes only. They do not necessarily reflect the views of MEXC. All rights remain with the original authors. If you believe any content infringes on third-party rights, please contact [email protected] for removal. MEXC makes no guarantees regarding the accuracy, completeness, or timeliness of the content and is not responsible for any actions taken based on the information provided. The content does not constitute financial, legal, or other professional advice, nor should it be considered a recommendation or endorsement by MEXC.

You May Also Like

Microsoft Corp. $MSFT blue box area offers a buying opportunity

Microsoft Corp. $MSFT blue box area offers a buying opportunity

The post Microsoft Corp. $MSFT blue box area offers a buying opportunity appeared on BitcoinEthereumNews.com. In today’s article, we’ll examine the recent performance of Microsoft Corp. ($MSFT) through the lens of Elliott Wave Theory. We’ll review how the rally from the April 07, 2025 low unfolded as a 5-wave impulse followed by a 3-swing correction (ABC) and discuss our forecast for the next move. Let’s dive into the structure and expectations for this stock. Five wave impulse structure + ABC + WXY correction $MSFT 8H Elliott Wave chart 9.04.2025 In the 8-hour Elliott Wave count from Sep 04, 2025, we saw that $MSFT completed a 5-wave impulsive cycle at red III. As expected, this initial wave prompted a pullback. We anticipated this pullback to unfold in 3 swings and find buyers in the equal legs area between $497.02 and $471.06 This setup aligns with a typical Elliott Wave correction pattern (ABC), in which the market pauses briefly before resuming its primary trend. $MSFT 8H Elliott Wave chart 7.14.2025 The update, 10 days later, shows the stock finding support from the equal legs area as predicted allowing traders to get risk free. The stock is expected to bounce towards 525 – 532 before deciding if the bounce is a connector or the next leg higher. A break into new ATHs will confirm the latter and can see it trade higher towards 570 – 593 area. Until then, traders should get risk free and protect their capital in case of a WXY double correction. Conclusion In conclusion, our Elliott Wave analysis of Microsoft Corp. ($MSFT) suggested that it remains supported against April 07, 2025 lows and bounce from the blue box area. In the meantime, keep an eye out for any corrective pullbacks that may offer entry opportunities. By applying Elliott Wave Theory, traders can better anticipate the structure of upcoming moves and enhance risk management in volatile markets. Source: https://www.fxstreet.com/news/microsoft-corp-msft-blue-box-area-offers-a-buying-opportunity-202509171323
Share
BitcoinEthereumNews2025/09/18 03:50
WTI drifts higher above $59.50 on Kazakh supply disruptions

WTI drifts higher above $59.50 on Kazakh supply disruptions

The post WTI drifts higher above $59.50 on Kazakh supply disruptions appeared on BitcoinEthereumNews.com. West Texas Intermediate (WTI), the US crude oil benchmark
Share
BitcoinEthereumNews2026/01/21 11:24
MYX Finance price surges again as funding rate points to a crash

MYX Finance price surges again as funding rate points to a crash

MYX Finance price went parabolic again as the recent short-squeeze resumed. However, the formation of a double-top pattern and the funding rate point to an eventual crash in the coming days. MYX Finance (MYX) came in the spotlight earlier this…
Share
Crypto.news2025/09/18 02:57