Ethereum (ETH) Price: ETH Is at a Crossroads — Here’s What Analysts Are Watching
TLDR
- ETH is trading around $2,181, testing a key support zone between $2,150 and $2,200.
- A drop below $2,150 could push ETH toward the $2,000 psychological level.
- The RSI sits at 53.53 and ETH is above its 20-day and 50-day moving averages but below the 100-day and 200-day.
- Weekly chart analysis from Ali Charts points to deeper support at $1,550 and $1,070 if current levels fail.
- Recovery toward $2,400 is possible if ETH holds above current support, with $2,624 as the next target beyond that.
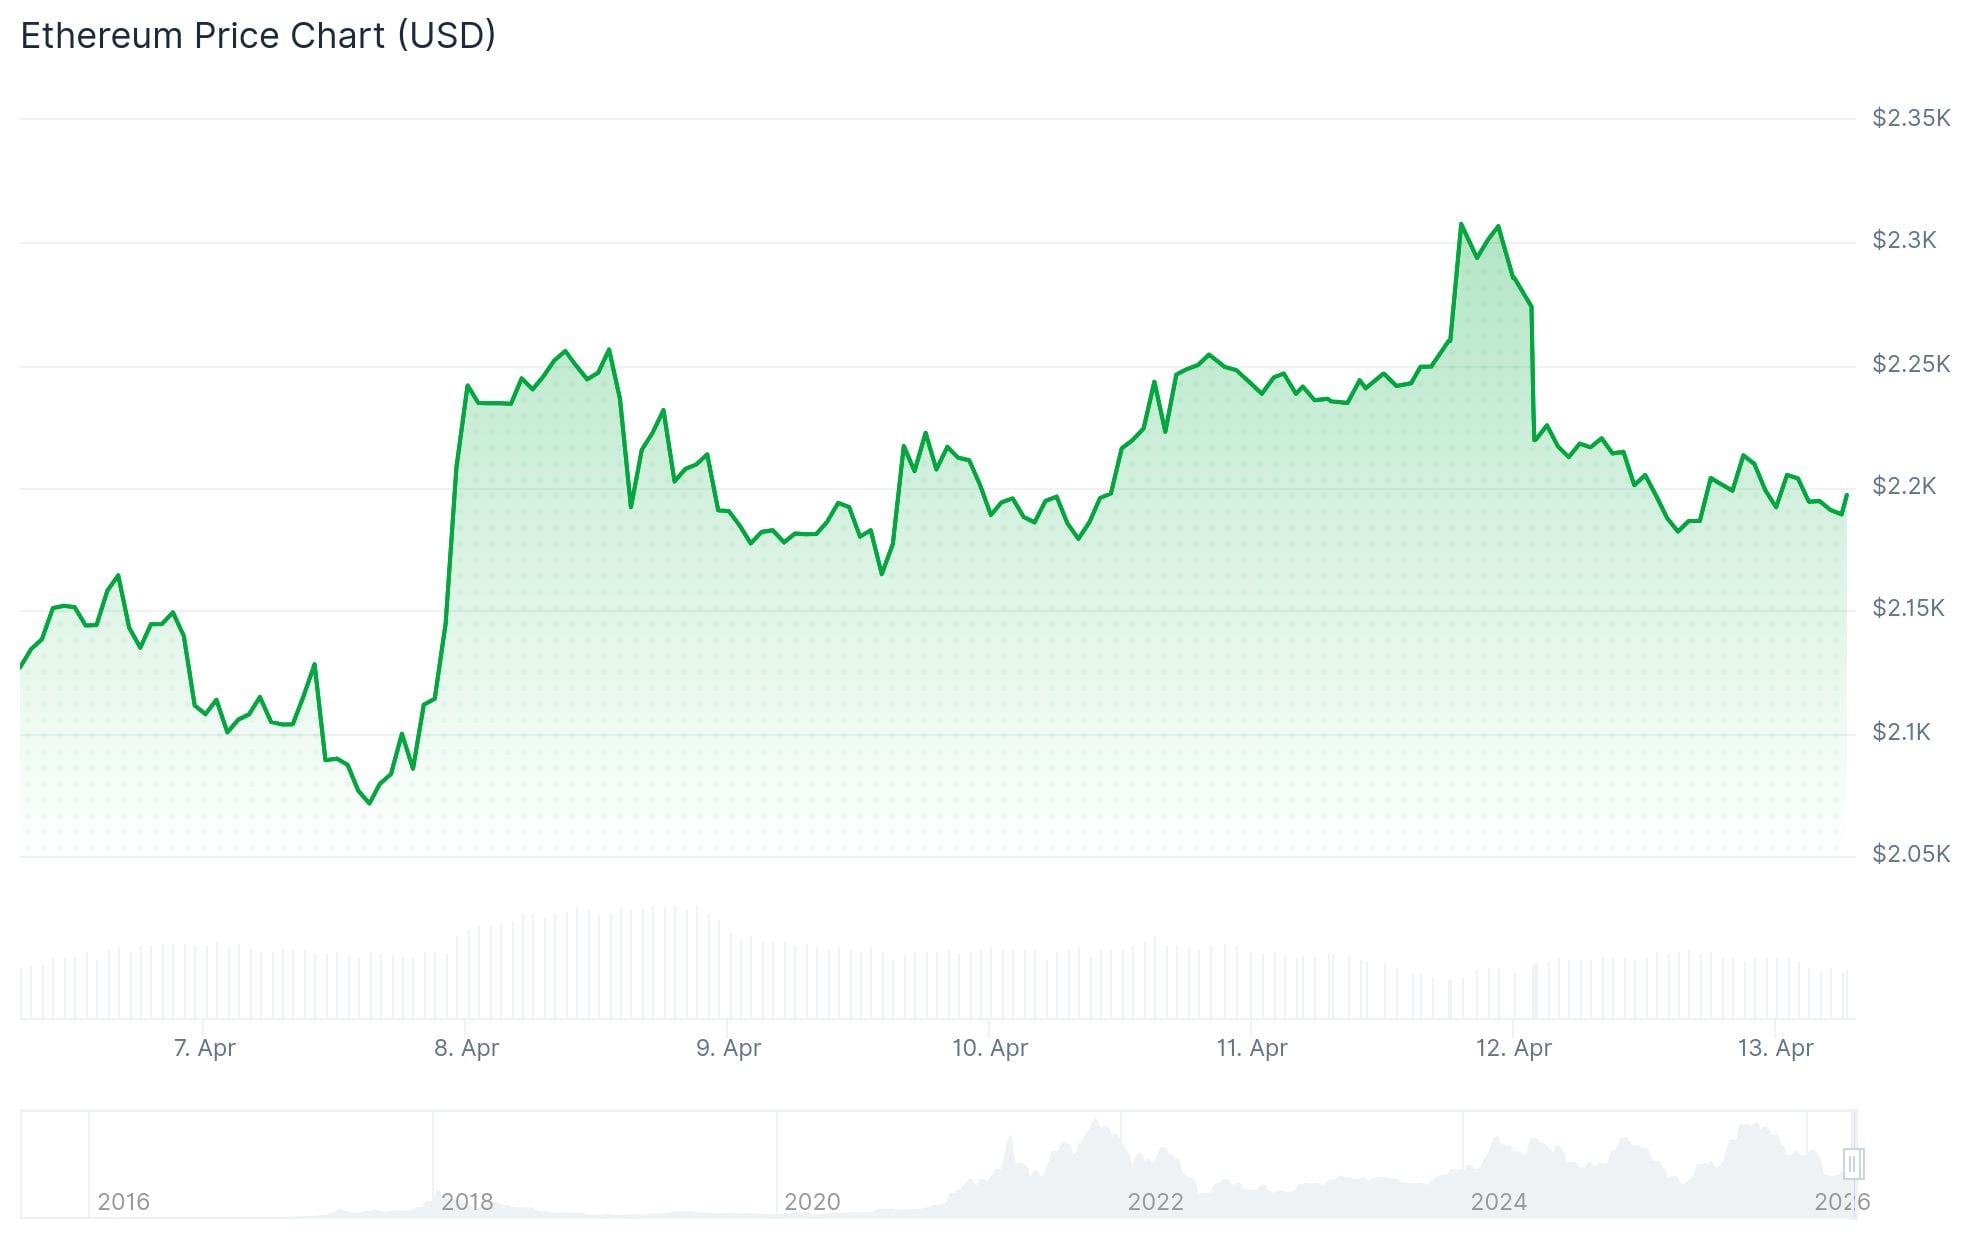
Ethereum is sitting at a price level that traders are watching closely. At the time of writing, ETH is trading at $2,181.19, down 2.89% over the past 24 hours. Trading volume stands at $28.19 billion, with a market cap of $263.38 billion.
 Ethereum (ETH) Price
The main focus right now is the $2,150–$2,200 zone. Analyst Ted flagged on X that Ethereum briefly came close to falling back below $2,200, driven by risk-off sentiment across global markets. He noted this zone is where buyers are likely to make their next move.
If ETH holds above $2,150, the short-term outlook points to consolidation and a possible push toward $2,400. That level is the first major resistance. After that, the chart shows a next target around $2,624.
If the $2,150 level breaks, the next downside target is $2,000 — a round-number level that has acted as psychological support in the past.
Technical Indicators Show Mixed Picture
On the technical side, the RSI is at 53.53, just above the average of 53.40. That reading leans slightly bullish but doesn’t show strong momentum in either direction.
ETH is trading above its 20-day SMA ($2,117.30) and 50-day SMA ($2,080.00), which means near-term support is still holding. However, the price remains below the 100-day SMA at $2,360.14 and the 200-day SMA at $2,918.05. That puts the broader trend in a weaker position.
The MACD line is slightly above the signal line, which may indicate early stabilization. But analysts say more buying pressure is needed before calling a clear recovery.
Weekly Chart Points to $1,550 and $1,070
Analyst Ali Charts posted a weekly Ethereum chart on X showing Ethereum may still be moving inside a parallel channel. According to the analysis, the two major downside levels to watch are $1,550 and $1,070.
These are not random numbers — both align with previous reaction areas on the weekly chart. The $1,550 level would be the first major floor if current support gives way. Below that, $1,070 is the deeper support level.
The daily chart also shows that if ETH loses the $2,155 area, the next stop is around $2,015. Below that, the chart points to $1,775 as another support zone.
As of April 13, 2026, ETH is trading at $2,181.19 with the $2,150 level as the key line in the sand for short-term price action.
The post Ethereum (ETH) Price: ETH Is at a Crossroads — Here’s What Analysts Are Watching appeared first on CoinCentral.


You May Also Like

Top 7 quantum AI stock trading bot free tools for beginners in 2026 to earn passive income

Trump's terrifying terrorist list likely has a new name on it — yours