

RaveDAO Doubles in 24 Hours: Breaking Down the 99% Surge and Market Structure
RaveDAO (RAVE) has emerged as the standout performer in today’s crypto markets, recording a 99.2% price surge that pushed the token from $7.92 to $15.78 within a 24-hour period. What makes this rally particularly noteworthy isn’t just the magnitude—it’s the velocity at which RAVE has climbed from its March 12 all-time low of $0.21 to current levels, representing a staggering 7,623% recovery in just over one month.
Our analysis of the market structure reveals several critical factors that both bulls and bears need to understand before taking positions in what has become a top-30 cryptocurrency by market capitalization.
The Numbers Behind the Rally: Volume and Market Cap Dynamics
The most striking data point in RaveDAO’s surge is the relationship between trading volume and market capitalization. With $535.5 million in 24-hour volume against a $3.9 billion market cap, we’re observing a volume-to-market-cap ratio of 13.7%. This sits slightly below the healthy 15-20% range typically associated with sustainable rallies, suggesting that while interest is robust, the move may be moderately overextended in the short term.
The market cap expansion of $1.71 billion in 24 hours—a 77.9% increase—tells us that new capital is flooding into RAVE at an unprecedented rate. To put this in perspective, the project added nearly half its previous total market capitalization in a single day. This type of explosive growth typically signals either a fundamental catalyst we haven’t yet identified or speculative positioning ahead of anticipated news.
What concerns us from a risk management perspective is the intraday volatility range. The token touched a high of $16.78 and a low of $7.49 within the same 24-hour period—a 124% spread between extremes. This level of volatility indicates that while conviction is building, price discovery remains chaotic and vulnerable to sharp reversals.
Token Supply Distribution and Dilution Risk Analysis
The token economics present a mixed picture that demands attention. RaveDAO currently has 248 million tokens in circulation against a maximum supply of 1 billion, meaning only 24.8% of total tokens are currently in the market. This creates a fully diluted valuation of $15.72 billion—more than four times the current market cap.
For context, if RAVE were valued at its FDV, it would rank approximately 15th among all cryptocurrencies, placing it ahead of established DeFi protocols and layer-1 blockchains. This valuation gap represents significant dilution risk as the remaining 752 million tokens enter circulation through whatever vesting or emission schedule the project employs.
We observe that the 4x differential between market cap and FDV is actually relatively moderate compared to some recent launches, but investors should model scenarios where gradual token unlocks create persistent selling pressure that could offset bullish momentum. The key question becomes: can demand growth outpace supply inflation?
Historical Price Action and Recovery Pattern Assessment
RaveDAO’s 30-day performance of 5,751% places it among the strongest monthly performers in crypto history. However, this recovery follows a catastrophic decline to $0.21 on March 12, 2026. The current price of $15.78 still sits 6.0% below the all-time high of $16.78 set earlier today, indicating we’re potentially at or near price discovery territory.
The weekly chart showing 5,917% gains suggests this isn’t a single-day pump but rather a sustained trend that has built momentum over approximately four weeks. This gradual acceleration pattern is generally healthier than vertical spikes, as it indicates layered buying at multiple price levels rather than a concentrated pump event.
What we find particularly interesting is the 1-hour price change of 2.4%, which shows continued buying pressure even after the massive 24-hour move. This suggests either strong hands accumulating on strength or algorithmic buying programs that remain active. Traditional technical analysis would flag this as an overbought condition, but momentum-driven markets can remain irrational far longer than conventional indicators suggest.
Comparative Analysis and Market Position Context
At rank #29 by market capitalization, RaveDAO now sits in rarified air, commanding more market value than many established blockchain projects. To contextualize this positioning: the project has achieved a valuation comparable to major DeFi protocols and some layer-1 networks, despite limited mainstream visibility outside crypto-native circles.
This raises critical questions about fundamental value versus speculative premium. Projects at this market cap tier typically have extensive developer ecosystems, significant total value locked in DeFi protocols, or clear utility driving organic demand. Without transparent on-chain metrics showing actual protocol usage, revenue generation, or ecosystem growth, we must consider that a substantial portion of current valuation represents speculation on future utility rather than present-day fundamentals.
The risk-reward profile has shifted dramatically. Early investors who bought near the March lows have realized generational returns, but new entrants at current levels face a different equation: meaningful upside requires either sustained protocol growth or continuation of speculative fervor. Both are possible, but neither is guaranteed.
Risk Factors and Contrarian Considerations
Our analysis identifies several red flags that prudent investors should weigh carefully. First, the 99% single-day surge falls into a pattern we’ve seen repeatedly in crypto markets: parabolic moves often precede sharp corrections as early buyers take profits and momentum traders exit when the music stops.
Second, the absence of detailed on-chain metrics in public data sources makes it difficult to verify whether this price action is supported by genuine protocol adoption or primarily driven by speculative trading. Transparency in user activity, transaction counts, and ecosystem development would provide confidence that fundamental value is accruing.
Third, the massive supply overhang (75.2% of tokens still not in circulation) creates a scenario where project insiders or early investors could theoretically dump substantial quantities into this liquidity without significantly impacting their remaining holdings. Vesting schedules and lock-up details become critical due diligence items.
Actionable Takeaways and Position Management
For prospective investors: Entry at current levels requires extremely high risk tolerance and conviction in RaveDAO’s fundamental value proposition. Consider dollar-cost averaging rather than lump-sum entry, and size positions according to personal risk parameters. A 99% daily move is not normal price action—expect continued high volatility in both directions.
For current holders: The prudent approach involves taking partial profits to secure gains while letting a core position run. Setting stop-losses at logical support levels (perhaps the $10-12 range where significant volume occurred during the ascent) can protect against catastrophic drawdowns while maintaining upside exposure.
For market observers: RaveDAO presents a case study in crypto market dynamics—where speculation, momentum, and possibly genuine utility converge. Monitoring how the token behaves after this initial euphoria subsides will provide valuable insights into whether a sustainable community and use case exist beneath the price action.
The ultimate question remains unanswered: Is RaveDAO building something fundamentally valuable enough to justify a $3.9 billion valuation, or have we witnessed another spectacular pump that will eventually mean-revert? The coming weeks will provide clarity, but investors should prepare for both scenarios with appropriate risk management frameworks.


You May Also Like

Egrag Crypto to XRP Investors: You’re Either Early Or You’re Exit Liquidity

ETH Enters High-Stakes Decision Zone
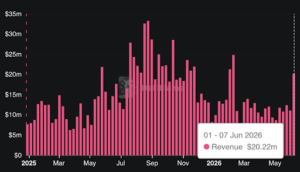
Hyperliquid Revenue Rebounds Above $20M as Open Interest Hits 7.9% Record


