

Ethereum (ETH) Surges Past $2,400 as Accumulation Wallets Reach All-Time Highs
Key Takeaways
- Ethereum has surged past $2,400, marking a 38% gain from its $1,750 low point
- Holdings in accumulation addresses increased by 33%, adding 6.5 million ETH since the start of January
- Technical analysis reveals a cup-and-handle formation projecting prices between $2,960 and $3,150
- Ethereum ETFs recorded $298.4 million in net inflows across seven consecutive trading sessions
- Geopolitical tensions eased after Iran reopened the Strait of Hormuz, contributing to ETH’s upward momentum
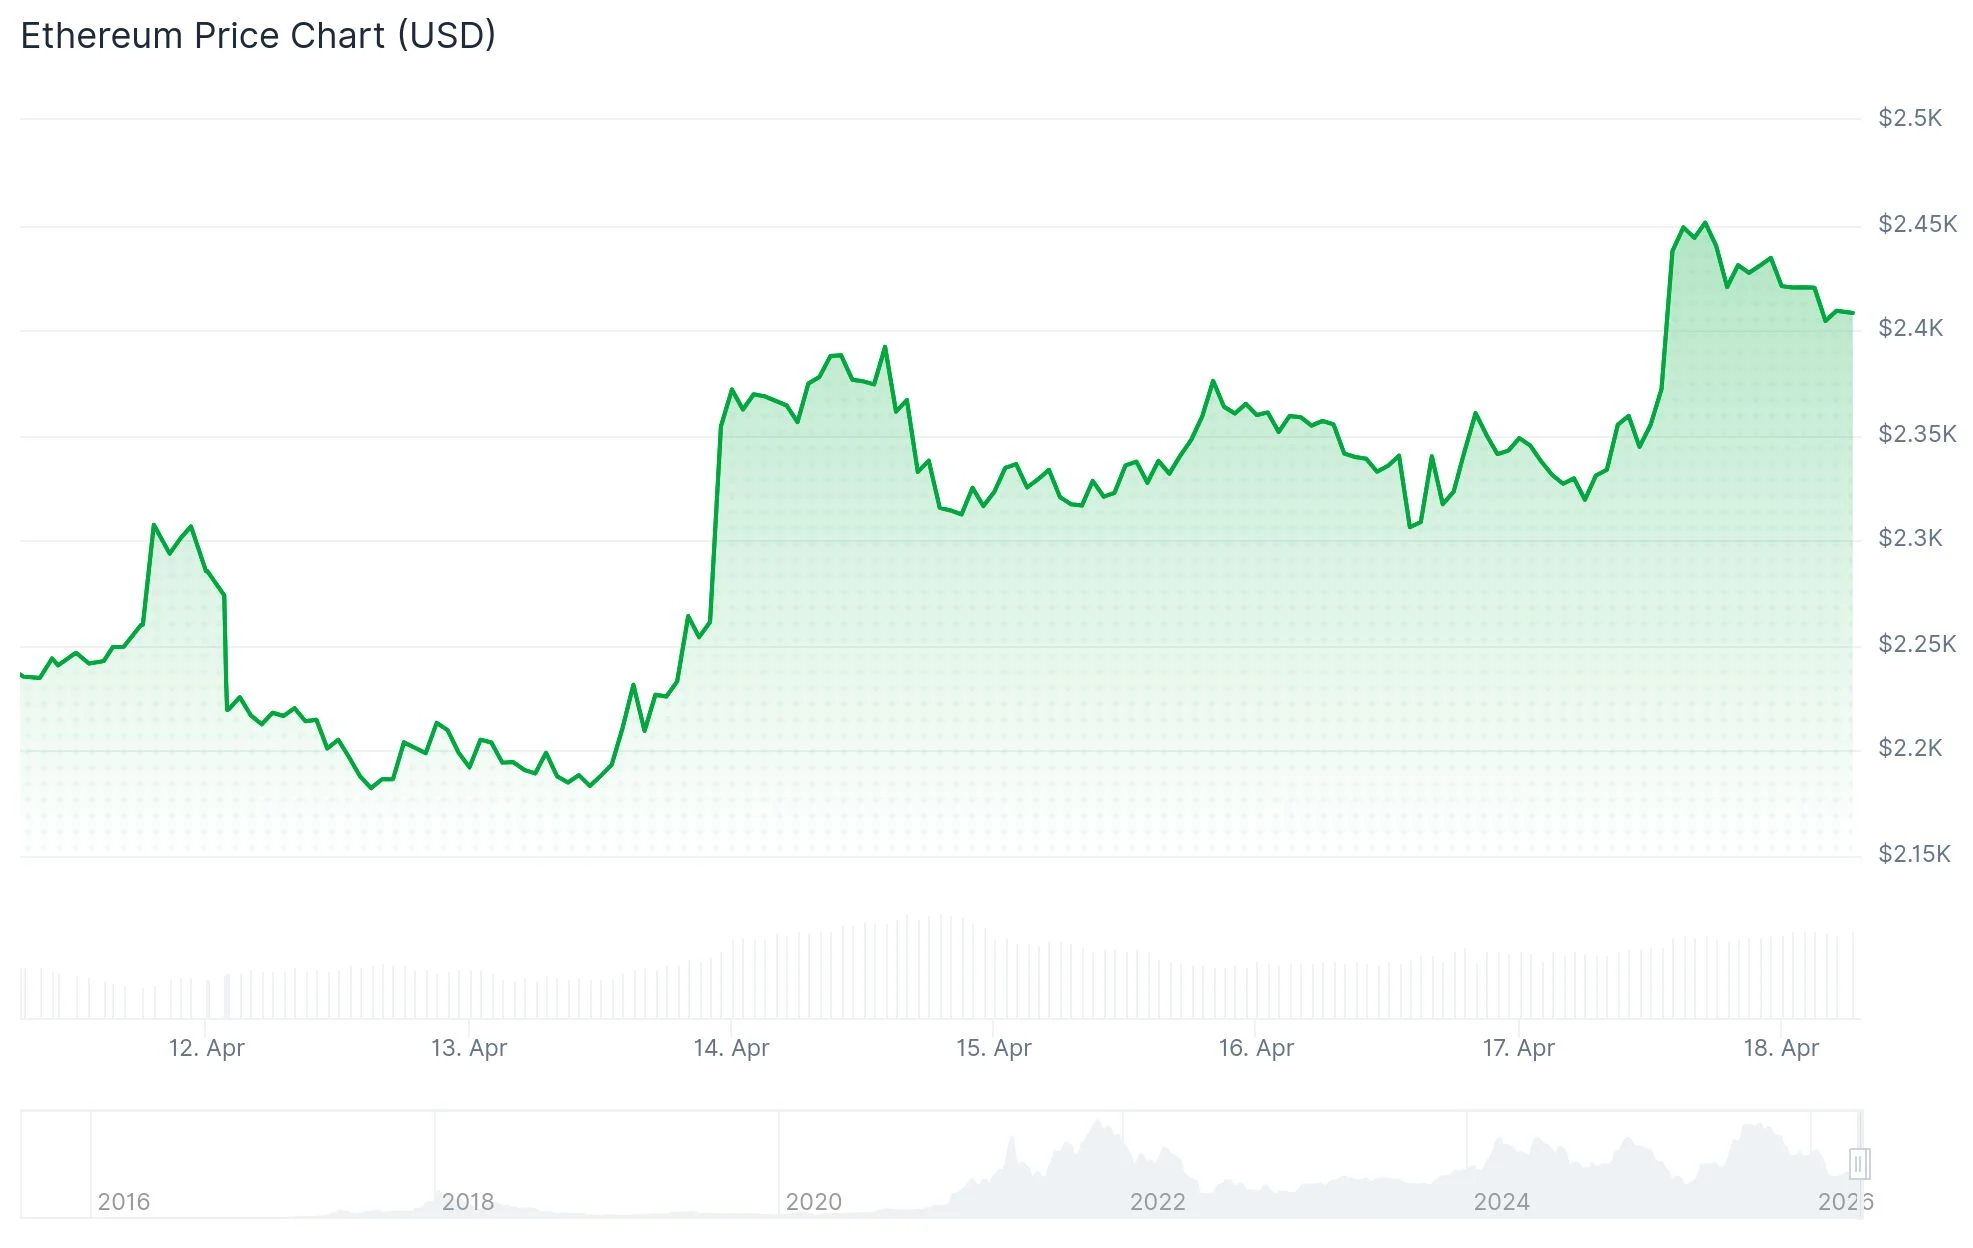
Ethereum’s price has broken through the $2,400 threshold, extending a recovery trend that originated from a low of $1,750. This advance represents approximately a 38% gain from that recent bottom. Multiple technical and blockchain metrics are now capturing the attention of market participants and cryptocurrency analysts.
 Ethereum (ETH) Price
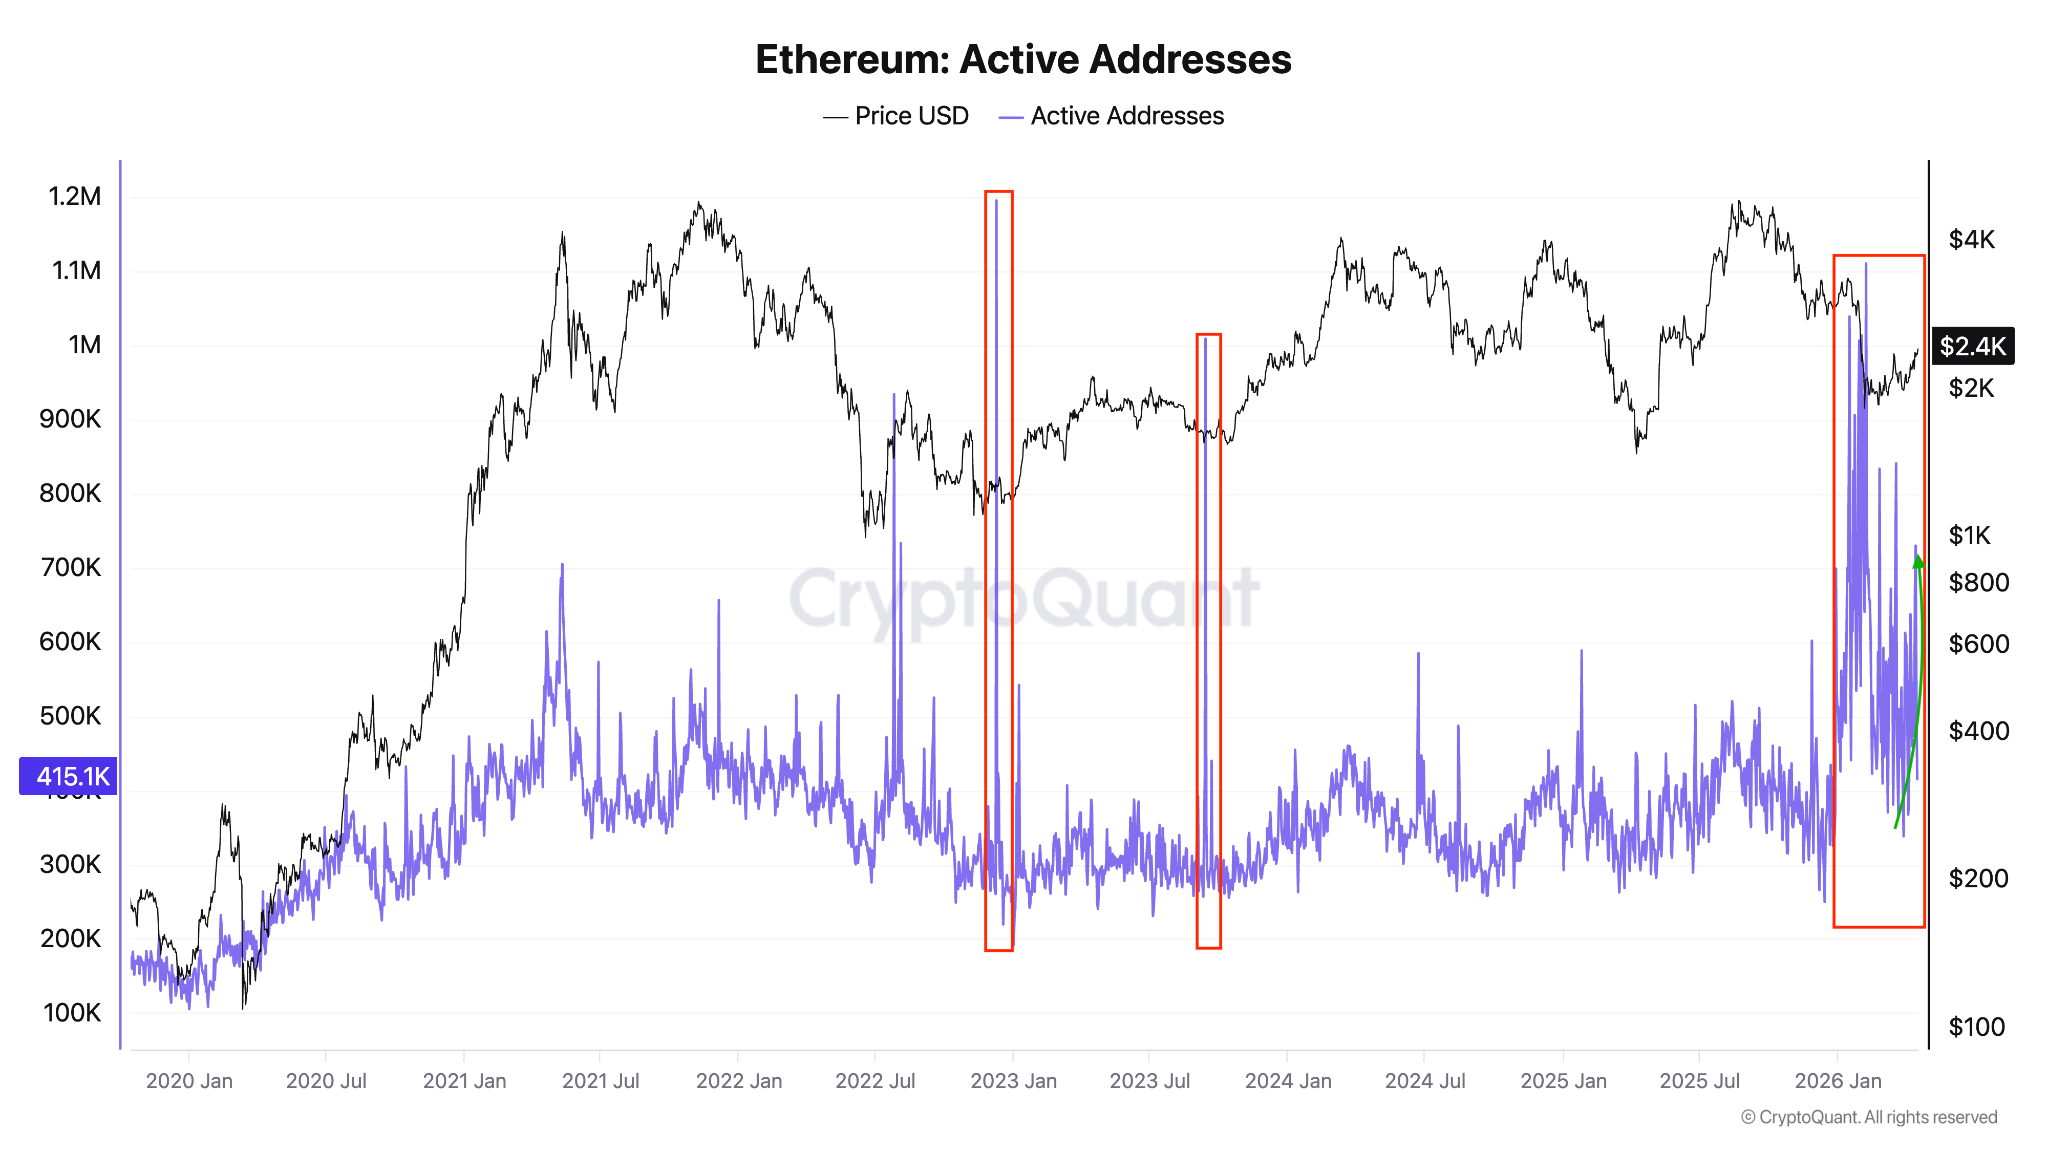
The number of daily active addresses on the Ethereum network surged by 89%, climbing from 384,763 to 730,278 on April 5. Historically, such spikes in network activity have coincided with market bottoms, including instances in 2022 that preceded significant price rebounds.
Accumulation addresses experienced record daily inflows of 1.14 million ETH in November 2025. Throughout 2026, these inflows have maintained an average of 200,000 ETH daily, with a notable surge to 358,000 ETH recorded on Thursday.
 Source: CryptoQuant
The aggregate ETH balance held in accumulation wallets—defined as addresses with no recorded selling activity—has expanded from 19.64 million to 26.16 million ETH since the beginning of January. This represents a substantial 33% increase.
Currently, 39.2 million ETH is locked in staking contracts. Simultaneously, ETH reserves on centralized exchanges have declined to multi-year lows, tightening the available liquidity in spot markets.
Technical Pattern Suggests Potential Move to $3,150
From a technical perspective, ETH has completed a breakout from a cup-and-handle formation on the 12-hour timeframe. A sustained close above the $2,400 neckline establishes a projected target near $2,960. The 14-day Relative Strength Index currently reads between 65 and 68, indicating bullish momentum.
Cryptocurrency analyst TheSkayeth highlighted a more extensive cup-and-handle pattern developing over a two-month period on the daily timeframe. The trader noted that ETH was “setting up for a massive move” and suggested that successful pattern completion would push prices into the “golden zone.” The measured price objective from this larger formation reaches $3,150.
Institutional Capital Returns Through ETF Products
Spot Ethereum ETFs have registered seven consecutive trading days of positive net inflows, accumulating $298.4 million in total, based on SoSoValue analytics. Specifically on April 17, spot Ethereum exchange-traded funds attracted $127 million in net inflows, according to Wu Blockchain reporting.
Ethereum’s valuation received additional support from diminishing geopolitical risks. Iran confirmed the reopening of the Strait of Hormuz following ceasefire progress involving the United States and Lebanon. ETH currently trades above its on-chain average cost basis of $2,308.
The Moving Average Convergence Divergence (MACD) indicator on ETH’s weekly chart has generated a golden cross signal—a technical development that previously identified price bottoms in November 2024 and May 2025.
Open interest in Ethereum derivatives has risen to 14.67 million ETH. Funding rates have shifted into negative territory, indicating that short sellers are establishing positions in anticipation of a consolidation phase. Within the last 24 hours, $163.2 million in ETH liquidations were executed, with $140.9 million stemming from short positions.
ETH’s near-term support level is positioned at the 100-day Exponential Moving Average around $2,378. Overhead resistance is identified at $2,746, with a more significant barrier located at $3,411.
The post Ethereum (ETH) Surges Past $2,400 as Accumulation Wallets Reach All-Time Highs appeared first on Blockonomi.


You May Also Like

The changing face of elder care in Malaysia — Sayed Mohammad Reza Yamani Sayed Umar

Not a loophole: Singapore AI export controls let China tap US AI legally

Best Mobile User Retention Tools in 2026


