

Analyst: This XRP vs Bitcoin Chart Says Price Will Go Up By 500% from Here
While Bitcoin continues to command the spotlight, many experienced traders are closely watching the XRP/BTC chart for signs of a major market rotation. This trading pair often reveals whether XRP is gaining strength against Bitcoin, and historically, strong XRP/BTC performance has preceded major rallies for the asset.
As investors search for the next breakout opportunity in the altcoin market, analysts believe XRP may be approaching a critical turning point. A long-term technical structure on the XRP/BTC chart now suggests that the asset could be preparing for a significant move higher.
CryptoBull Highlights Key Support Zone
Crypto analyst CryptoBull recently shared this view in a post on X, pointing to the weekly XRP/BTC chart on Bitstamp. According to CryptoBull, XRP is compressing near a major multi-year support trendline that has remained intact since 2017.
The chart shows XRP trading around 0.000001887 BTC and pressing against a long-standing descending structure. CryptoBull overlaid the chart with a bold upward projection and stated that this setup could send XRP at least 500% higher against Bitcoin from its current level.
The analyst believes the repeated defense of this support zone signals weakening downside pressure and growing potential for a breakout. If that pattern holds, XRP could revisit levels not seen since the stronger altcoin cycles.
Why the XRP/BTC Pair Matters
Many retail investors focus only on XRP’s U.S. dollar value, but professional traders often monitor XRP/BTC more closely. This chart measures XRP’s strength relative to Bitcoin and helps identify when capital may rotate from Bitcoin into major altcoins.
A strong move in XRP/BTC usually signals that XRP is outperforming Bitcoin, even if both assets are rising. A 500% gain from the current level would push the pair toward 0.000011 BTC, marking a major recovery from its recent lows.
This kind of breakout often attracts broader investor attention and can trigger renewed momentum across the XRP market.
Fundamentals Add Strength to the Bullish Case
Technical patterns become stronger when fundamentals support them. XRP’s long-term outlook improved significantly after Ripple fully concluded its legal battle with the U.S. Securities and Exchange Commission in 2025.
Since then, institutional confidence has grown across the XRP ecosystem. Ripple has continued expanding its global payments business, while the XRP Ledger has gained momentum through tokenization efforts, enterprise development, and rising stablecoin activity.
Ripple’s stablecoin, RLUSD, launched in late 2024, also drew attention to XRP Ledger’s utility and long-term adoption.
Confirmation Still Matters
Despite the bullish projection, analysts stress that chart patterns need confirmation before they become reality. XRP has approached major breakout zones several times in recent years without sustaining momentum.
CryptoBull’s forecast reflects strong optimism, but traders still need stronger volume and broader market support to confirm a full reversal. For now, the XRP/BTC chart remains one of the most important indicators for investors watching XRP’s next major move.
Disclaimer: This content is meant to inform and should not be considered financial advice. The views expressed in this article may include the author’s personal opinions and do not represent Times Tabloid’s opinion. Readers are urged to do in-depth research before making any investment decisions. Any action taken by the reader is strictly at their own risk. Times Tabloid is not responsible for any financial losses.
Follow us on Twitter, Facebook, Telegram, and Google News
The post Analyst: This XRP vs Bitcoin Chart Says Price Will Go Up By 500% from Here appeared first on Times Tabloid.


You May Also Like
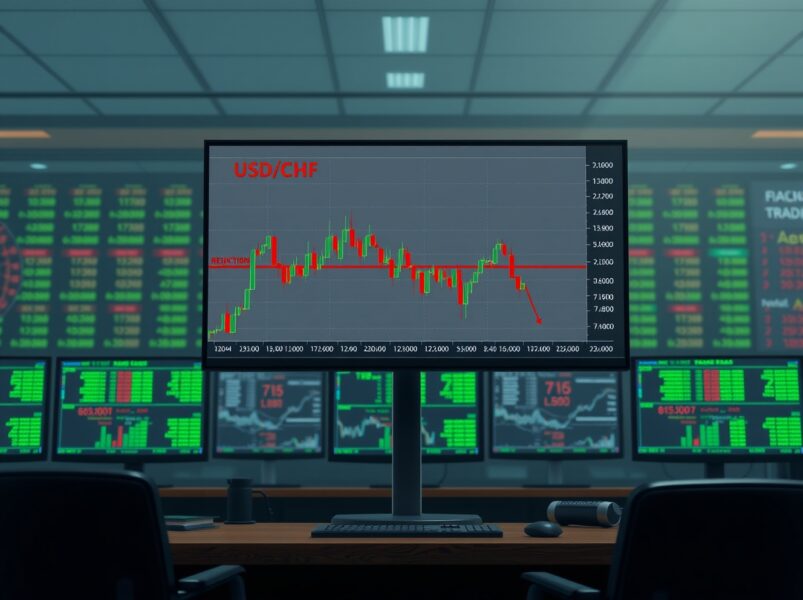
USD/CHF Price Forecast: Critical 100-day SMA Rejection Pushes Pair Toward 0.7800 Support
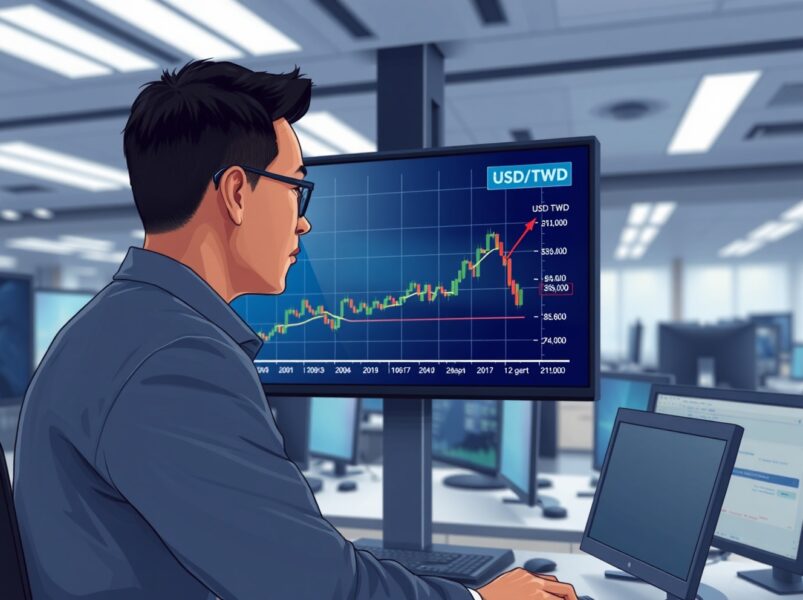
USD/TWD Rebound: A Fadeable Move According to OCBC Analysis


