

ETH Breakdown Confirms Bearish Move as Price Slips Below Key Channel Support
ETH broke below rising channel support after failing near $2,290-$2,330, with traders watching $2,214 and $2,161 support levels.
Ethereum moved lower after a confirmed break below rising channel support, and the latest chart signals a weaker short-term outlook.
The setup had been under pressure near resistance, and sellers gained control once support failed.
As a result, traders are now watching lower price levels and momentum signals for the next move.
Channel Break Puts Focus on Lower Levels
$ETH Breakdown confirmed from the channel, exactly as expected. Price is now moving lower after losing key support.
The reaction has been clean, showing how well the level held and then failed. From here, continuation toward lower levels looks likely. Keep an eye on downside momentum.
That market view matched the latest move on the daily chart. Ethereum had been trading inside a rising channel during its recovery phase.
However, that structure broke once buyers failed to defend support.
Earlier, the price had climbed from the February low near $1,937. That rebound created a series of higher lows through March and early April.
Still, the advance started to slow as Ethereum approached a tougher resistance zone.
That resistance sat between $2,290 and $2,330. Price tested that area several times, but buyers could not push through with strength.
Once support gave way, the chart turned weaker and opened the door to further losses.
Fibonacci Levels Now Shape the Setup
The chart’s Fibonacci range ran from the swing high near $3,111.8 to the low near $1,937.5.
That placed the 0.618 retracement at $2,214.7. It also placed the 0.786 retracement at $2,290.0. During the rebound, Ethereum moved back above $2,214.
That helped keep the broader recovery intact for a time. Then the price reached the $2,290 area and started to lose momentum.
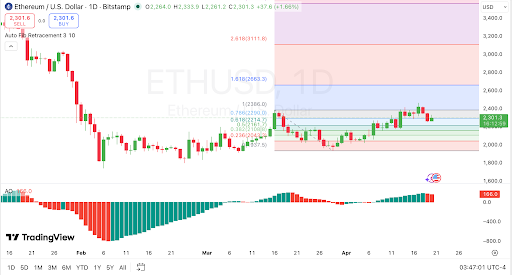 ETH tests $2,290 support as daily momentum slows, source: TradingView.
That zone became a key decision point for the market. Buyers needed a firm push higher to keep the rebound going.
Instead, the move stalled, and the later channel break added to the downside case. The next support levels now sit near $2,214 and $2,161.
Below that, traders may watch the $2,108 to $2,043 range. If Ethereum falls below $2,043, attention could shift back to the February low near $1,937.
Read Also:
Momentum and Positioning Show a Fragile Market
Momentum had stayed positive on the daily chart, but it was already slowing. The Awesome Oscillator remained above zero before the breakdown.
Even so, the latest bars turned lower and showed fading upside strength. That loss of momentum fit the recent price action near resistance.
Ethereum had reached the upper retracement zone, but it could not hold firm there. As momentum cooled, the break below channel support became more likely.
Positioning data also showed a market still leaning long. Binance ETH/USDT long-to-short accounts stood at 2.1319, while OKX showed 1.57.
Binance top trader accounts were net long at 1.6567, though positions were only 1.09.
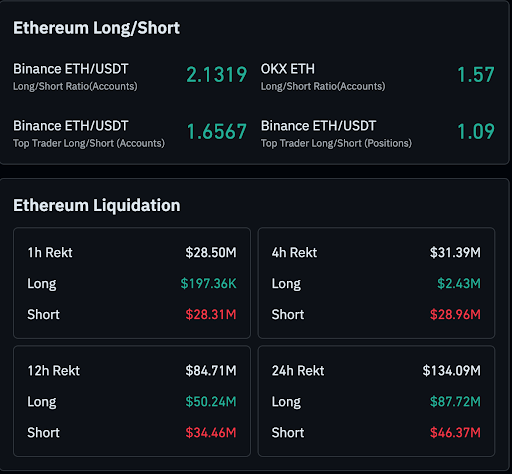 ETH liquidation stays mixed across key time frames, source: Coinglass.
That split suggested bullish interest remained, but large traders were not heavily sized.
Liquidation data also pointed to a mixed backdrop. Short liquidations dominated over one hour and four hours, but long liquidations were larger over 12 hours and 24 hours.
Taken together, the data showed a market that had seen a short squeeze, yet still lacked firm trend stability.
The broader session remained volatile, and long-heavy positioning may now add pressure if support levels fail.
For now, Ethereum’s short-term picture looks bearish unless price quickly reclaims the lost channel and nearby resistance.
The post ETH Breakdown Confirms Bearish Move as Price Slips Below Key Channel Support appeared first on Live Bitcoin News.


You May Also Like

IRRA Testnet Progress Sparks Competition Among Pi Network Pioneers in Web3 Development Race

Why Scaramucci Believes Bitcoin Could Reach $1 Million


