

Gold Price Analysis: Resilient Rally Follows Gap Lower as Traders Weigh Escalating US-Iran Tensions
BitcoinWorld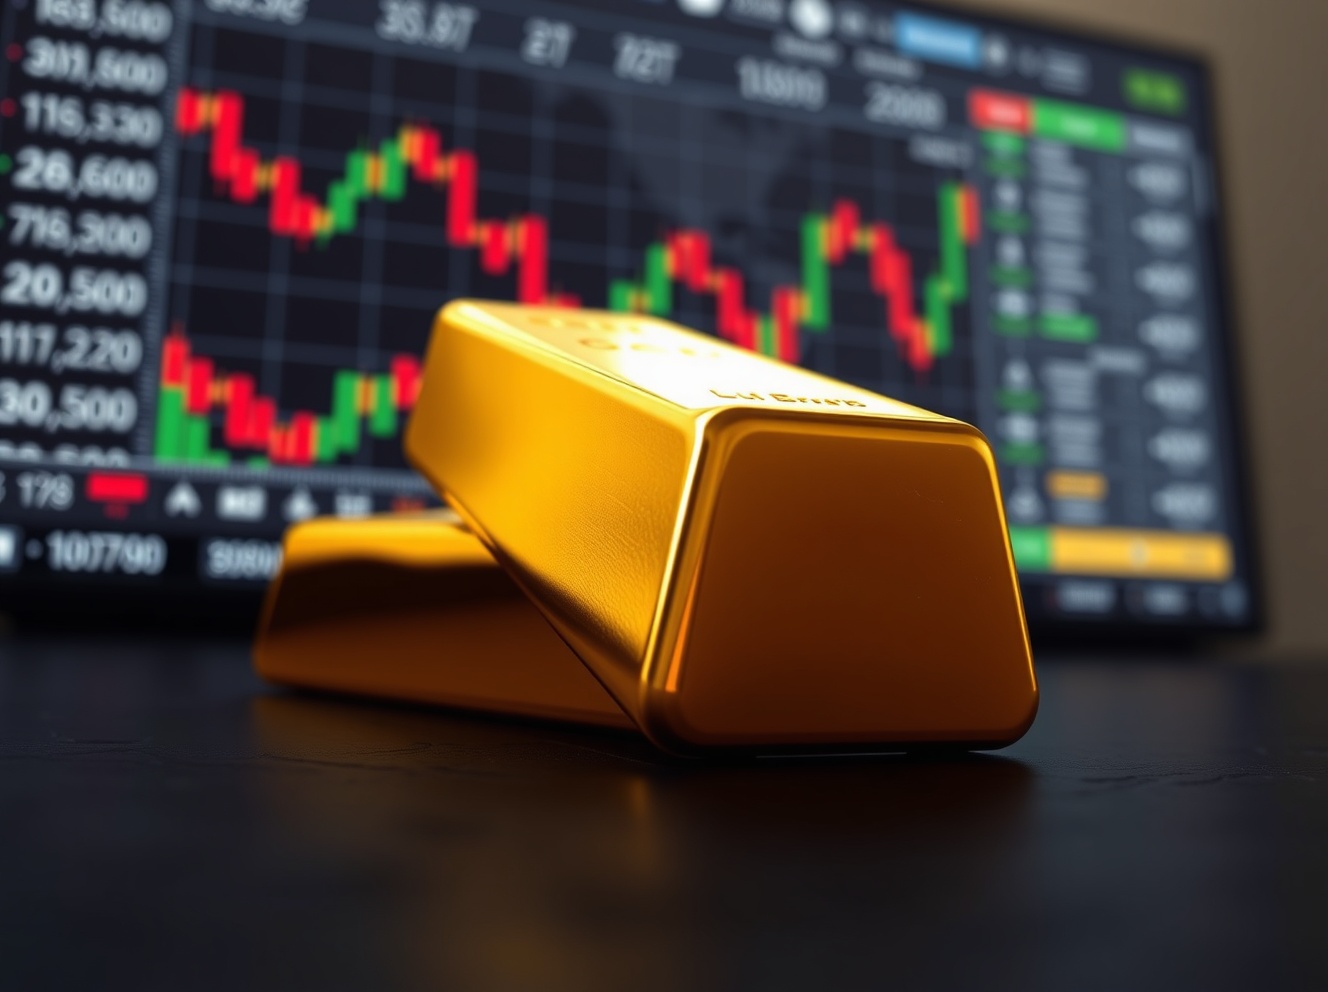
Gold Price Analysis: Resilient Rally Follows Gap Lower as Traders Weigh Escalating US-Iran Tensions
Global gold markets demonstrated notable resilience on Tuesday, March 18, 2025, as prices firmed significantly after a sharp gap lower at the Asian open, with traders and analysts intently assessing fast-moving developments between the United States and Iran. The precious metal, a traditional safe-haven asset, initially sold off on perceived de-escalation headlines before buyers stepped in, highlighting the complex interplay between geopolitical risk and macroeconomic signals. This price action underscores gold’s enduring role as a barometer for global uncertainty, particularly in the Middle East.
Gold Price Analysis: Deciphering the Intraday Reversal
The trading session began with a pronounced downward gap, pushing spot gold prices briefly below the psychologically significant $2,150 per ounce level. However, the sell-off proved short-lived. Consequently, a swift reversal unfolded throughout the European morning. Market participants quickly reassessed earlier headlines, leading to sustained buying interest. This intraday volatility perfectly illustrates how modern algorithmic trading reacts to geopolitical news flows. Furthermore, the recovery was supported by physical buying interest in key Asian markets, providing a solid floor for prices.
Technical analysts immediately noted the importance of the $2,140 support zone. This level had previously acted as strong resistance in late 2024. A successful hold above this price point signals underlying market strength. The subsequent rally reclaimed the 20-day moving average, a key short-term momentum indicator. For institutional traders, this price action suggests that the broader uptrend for gold, which began in late 2023, remains structurally intact despite headline-driven noise.
Geopolitical Risk Markets and the US-Iran Calculus
The primary catalyst for the session’s volatility stemmed from conflicting reports regarding diplomatic communications in the Persian Gulf. Initial news wires suggested a potential cooling of rhetoric, prompting a risk-on move that pressured gold. Subsequently, more detailed analysis from regional experts and official statements clarified the situation. The core tensions, related to maritime security and nuclear protocol compliance, showed no signs of fundamental resolution. This realization triggered the safe-haven flow back into gold.
Expert Analysis on Safe-Haven Flows
Dr. Anya Petrova, Head of Commodity Strategy at Global Macro Advisors, provided context. “Markets are trading on two timelines,” she explained. “The immediate algorithmic reaction is to headline keywords. The subsequent human-driven reaction is to context and probability. Today’s gold price action shows the market assigning a higher probability to prolonged regional friction rather than a quick diplomatic fix.” This analysis is supported by rising volumes in gold options markets, indicating that institutional investors are hedging against further geopolitical surprises.
The historical correlation between Middle East tensions and gold prices remains strong. A comparative analysis of similar events shows a clear pattern. For instance, the 2020 escalation following the Qasem Soleimani strike saw gold volatility spike by over 300% within a week. While the current situation differs, the market’s memory influences trader behavior. Analysts also monitor the U.S. Dollar Index (DXY) and Treasury yields, as gold often moves inversely to these assets. On this day, a slight softening in the dollar provided additional tailwinds for the gold recovery.
Broader Commodity Market Trends and Intermarket Dynamics
Gold’s movement did not occur in a vacuum. The entire commodity complex experienced ripple effects. Silver, often more volatile than gold, saw an even sharper percentage rebound. Meanwhile, industrial metals like copper traded on separate, growth-oriented fundamentals. This divergence highlights gold’s unique status. Its price is less tied to industrial demand and more sensitive to real interest rates and fear premiums. The following table summarizes key intermarket movements during the session:
| Asset | Initial Reaction | Session Close | Key Driver |
|---|---|---|---|
| Gold (XAU/USD) | Sharp Gap Lower | Firm, +0.8% | Geopolitical Reassessment |
| Silver (XAG/USD) | Followed Gold Lower | Strong, +2.1% | Leveraged Safe-Haven Play |
| U.S. Dollar (DXY) | Strengthened | Moderately Weaker | Risk Sentiment Shift |
| Brent Crude Oil | Spiked Higher | Holding Gains | Direct Regional Supply Risk |
Several structural factors support gold in the current 2025 macro environment. Central bank demand, particularly from institutions in emerging markets, continues at a robust pace. These banks are diversifying reserves away from traditional fiat currencies. Additionally, the global macroeconomic backdrop of elevated, albeit cooling, inflation makes gold an attractive real asset. Market participants are also closely watching the Federal Reserve’s forward guidance. Any signal that rate cuts could be delayed typically supports the dollar and pressures gold, adding another layer to the current analysis.
Conclusion
The day’s gold price analysis reveals a market that is sophisticated and reactive. The initial gap lower and subsequent firming demonstrate how prices absorb and process complex geopolitical information in real time. The resilience shown suggests that underlying demand for the precious metal remains healthy, supported by both tactical safe-haven flows and longer-term strategic buying. As US-Iran tensions continue to evolve, gold will likely remain a critical asset for investors seeking to manage portfolio risk. Its performance serves as a clear reminder that in an interconnected world, geopolitical developments in one region can swiftly reverberate through global capital markets.
FAQs
Q1: Why did gold prices initially fall at the open?
Gold prices gapped lower due to initial market headlines that suggested a potential de-escalation in US-Iran tensions. Algorithmic trading systems often react first to such keywords, triggering a short-term sell-off in safe-haven assets.
Q2: What caused gold to reverse and firm up later in the session?
The reversal was driven by a more nuanced analysis of the situation. Traders and analysts, upon reviewing detailed reports and expert commentary, concluded that the core geopolitical risks remained largely unchanged, prompting renewed safe-haven buying.
Q3: How do US-Iran tensions typically affect gold markets?
Historically, escalations in Middle East geopolitics, especially involving major powers, increase global uncertainty. This typically boosts demand for gold as a safe-haven, non-yielding asset that is perceived as a store of value during turbulent times.
Q4: What other assets are influenced by these geopolitical events?
Crude oil prices are highly sensitive due to the region’s energy production. The U.S. dollar and Treasury yields often see safe-haven flows, while equity markets, particularly in sectors like aerospace and defense, can also experience volatility.
Q5: What are the key technical levels traders are watching for gold now?
Analysts are monitoring the recent support zone around $2,140-$2,150 per ounce. A sustained break above $2,180 could signal a resumption of the broader bullish trend, while a break below $2,130 might indicate a deeper correction is underway.
This post Gold Price Analysis: Resilient Rally Follows Gap Lower as Traders Weigh Escalating US-Iran Tensions first appeared on BitcoinWorld.


You May Also Like

The changing face of elder care in Malaysia — Sayed Mohammad Reza Yamani Sayed Umar

Not a loophole: Singapore AI export controls let China tap US AI legally

Exclusive interview with Smokey The Bera, co-founder of Berachain: How the innovative PoL public chain solves the liquidity problem and may be launched in a few months


