

Crypto Price Prediction for Today (April 21): AAVE, XRP, and Dogecoin (DOGE)
Aave, XRP, and Dogecoin are starting today (April 21, 2026) with very different short term signals, even though all three have spent weeks trapped in wider consolidation or bearish structures.
Aave is attempting a recovery after forming a double bottom near $86, XRP continues to hold its long-standing range between $1.25 and $1.53, and Dogecoin is pushing upward again after bouncing from $0.094. That mix of setups could indicate the start of stronger momentum or just another day inside familiar ranges.
AAVE Price Structure Shows Short-Term Recovery Within A Broader Bearish Channel
Aave has started to form what looks like a temporary bottom after printing a double bottom pattern near $85 on April 7 and again around $86 on Monday. The bounce that followed yesterday has extended into today with a roughly 5% gain, and that move hints at fresh bullish pressure entering the market.
The broader structure still leans bearish as price continues to trade inside a descending channel. This limits how far any rally can go without a confirmed breakout. Current action shows a short-term bullish tilt, though the larger trend has not flipped.
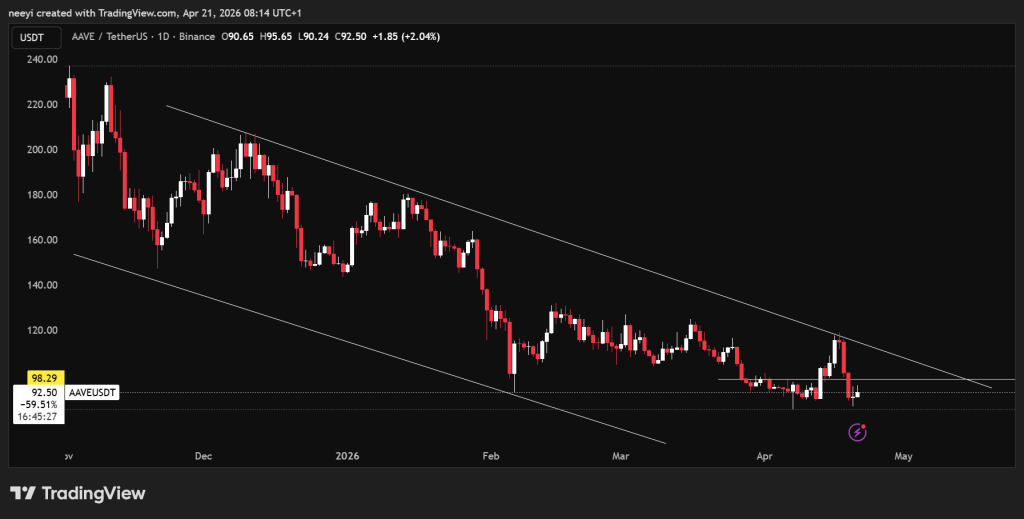 AAVE Price Chart Showing Descending Channel Pattern / Source: TradingView.com
Immediate resistance stands close to $98. That level has acted as both support and resistance several times since February, which makes it the first key test for today. A move above $98 could open a path toward $102, where the next barrier sits.
Support between $90 and $95 is equally important. Price may spend time moving sideways inside that band if buyers fail to push through resistance early.
Below is the AAVE indicator reading on a 5-hour timeframe from Investing.com
| Name | Value | Action |
|---|---|---|
| RSI (14) | 44.666 | Sell |
| STOCH (9,6) | 45.632 | Neutral |
| MACD (12,26) | -2.55 | Sell |
| ADX (14) | 48.153 | Sell |
| Ultimate Oscillator | 51.311 | Buy |
| Bull/Bear Power (13) | -3.344 | Sell |
These readings appear surprisingly bearish despite the recent bounce. Indicators often lag behind price movement, but they still capture the underlying pressure that has dominated the market.
A look at the 5-hour chart shows that selling strength remains dominant across most metrics. RSI sits below neutral, MACD stays negative, and Bull Bear Power remains deep in bearish territory. ADX also points to a strong trend, and that trend still leans downward.
Aave Price Prediction For Today Based On Key Levels And Indicator Bias
Two clear scenarios stand out based on current structure.
- A move above $95 would increase the chances of testing $98, and a strong push beyond that level could extend toward $102.
- A failure to break above $95 could lead to consolidation between $90 and $95 through most of today.
The strongest bias right now points toward consolidation between $90 and $95 if momentum stays unchanged, especially since indicator readings still favor a bearish backdrop.
XRP Price Continues Range Bound Movement With Slight Bullish Tilt
XRP has not shown any major structural change recently, as the price continues to move inside a well-defined range. Since early February, XRP has traded mostly between $1.25 and $1.53.
Current resistance sits at $1.47. A break above that level could push price toward $1.53 during today’s session. Support near $1.39 plays a key role as well, and a break below it could open a move toward $1.33.
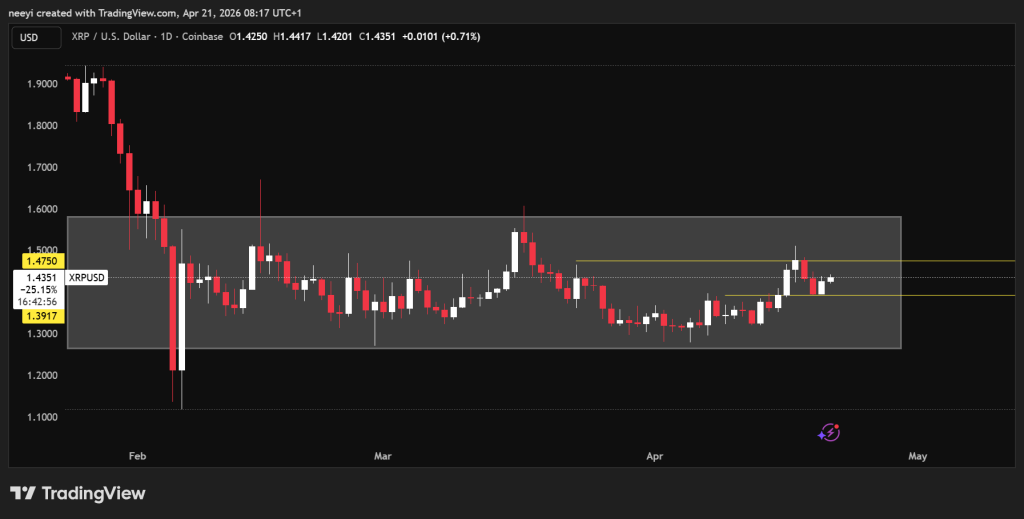 Ripple (XRP) Price Chart Showing Consolidation Pattern / Source: TradingView.com
The lack of a strong catalyst keeps price contained, which means range trading remains the dominant behavior for now.
Indicator data from Investing.com shows a clear short-term bullish bias. RSI remains above neutral, MACD has turned positive, and both stochastic and the ultimate oscillator support upward movement.
ADX sits below strong trend levels, which suggests that the current move lacks strength. Even so, most indicators lean toward buyers having control in the near term.
| Name | Value | Action |
|---|---|---|
| RSI (14) | 55.298 | Buy |
| STOCH (9,6) | 58.612 | Buy |
| MACD (12,26) | 0.009 | Buy |
| ADX (14) | 28.156 | Sell |
| Ultimate Oscillator | 57.134 | Buy |
| Bull/Bear Power (13) | 0.0012 | Buy |
XRP Price Prediction For Today Based On Range Behavior And Momentum
The strongest bias favors upward movement in the short term. Price may test $1.475 first, and a clean break above that level could push XRP toward $1.50.
A weaker scenario would involve a drop below $1.39. That move could lead to $1.35 and possibly $1.33 if selling pressure builds.
Dogecoin Price Moves Toward Upper Range After Recent Bounce
Dogecoin has followed a similar pattern, with price staying range bound since late January between $0.09 and $0.10. Recent action shows buyers stepping in again as DOGE price attempt to move upward for a second straight day.
DOGE currently trades near $0.095 after bouncing from support around $0.094. That move puts the upper boundary near $0.098 back into focus.
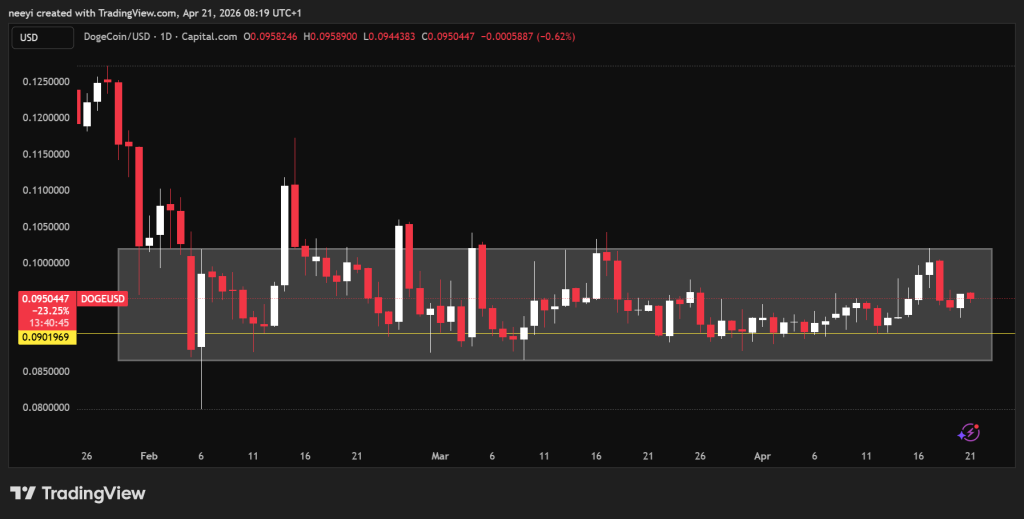 DOGE Price Chart Showing Consolidation Pattern / Source: TradingView.com
Support at $0.0936 remains critical. A break below that level could lead to further downside toward $0.091.
The readings from Investing.com’s analysis of the 5-hour chart point to a bullish bias overall. Most indicators support upward movement, even though stochastic shows some hesitation.
The combination of neutral to positive signals supports the current recovery attempt.
| Name | Value | Action |
|---|---|---|
| RSI (14) | 55.526 | Buy |
| STOCH (9,6) | 44.818 | Sell |
| MACD (12,26) | 0 | Buy |
| ADX (14) | 31.209 | Buy |
| Ultimate Oscillator | 52.217 | Buy |
| Bull/Bear Power (13) | 0.001 | Buy |
Dogecoin Price Prediction For Today Based On Momentum And Key Resistance
The current outlook leans bullish based on indicator readings and price structure. A move above $0.096 could open the door for a push toward $0.098 during today’s session.
That scenario stands as the more likely outcome if momentum continues at the same pace.
A shift toward bearish conditions would require a break below $0.0936. That move would invalidate the current bullish setup and expose lower levels.
FAQs
Subscribe to our YouTube channel for daily crypto updates, market insights, and expert analysis.
The post Crypto Price Prediction for Today (April 21): AAVE, XRP, and Dogecoin (DOGE) appeared first on CaptainAltcoin.


You May Also Like
Japanese Yen Falls Despite Bank of Japan Rate Hike: What Traders Missed

DOJ Announces 455 Defendants Charged in $6.5 Billion Health Care Fraud Crackdown

‘The bomohs wanted to help’: Firdaus’s journey with ichthyosis


