

Silver Price Forecast: US‑Iran Peace Talks Collapse Could Trigger a Precious Metals Sell‑Off
Silver Stalls at $79 as Analyst Warns of Geopolitical Storm.
The silver price is at $79 per ounce at press time, showing little to no movement over the past few days. The metal has been stuck in a tight range, as if holding its breath. Rashad Hajiyev, one of the most vocal silver analysts on X, believes this calm may be the quiet before a storm. His analysis is often contrarian but well‑reasoned, and his long‑term track record on silver has earned him a following.
Rashad Hajiyev’s Take – “The Arrow Has Left the Bow”
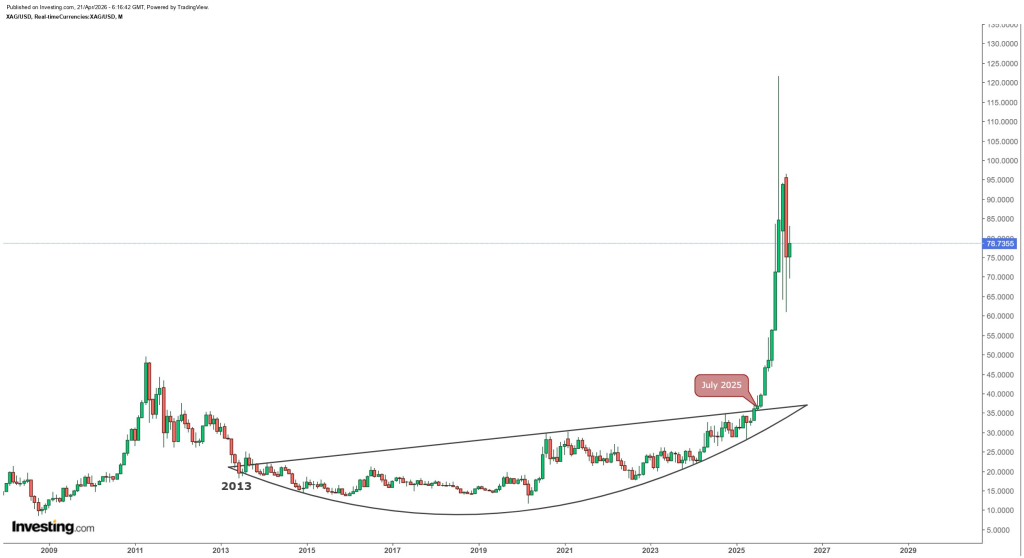
Hajiyev shared a monthly XAG/USD chart from Investing.com spanning 2013 to 2029. The chart shows silver breaking out from a 12‑year base in July 2025, with the price climbing from below $30 to a peak near $130 before pulling back. He argues that the breakdown of US‑Iran peace talks could trigger another round of sell‑offs in precious metals, but only in the short term.
His core view is that the arrow has left the bow, and there is no turning back until fundamental global economic issues are addressed – especially the debt problem. He calls the rest “rhetoric and short‑term noise designed to distract.” The monthly chart shows silver currently consolidating near $80, with a long‑term ascending channel pointing toward $130 and beyond. Hajiyev does not see a solution to the modern fiat system. Therefore, precious metals remain winners, regardless of temporary geopolitical scares.
 Source: X/@hajiyev_rashad
News That Affects Silver Price – Deficit, Fed Policy, and Supply Chains
The silver market faces a projected deficit of 46.3 million troy ounces in 2026, up 15% from 2025. That marks the sixth straight year of shortfalls, driven by industrial demand outpacing mine output and recycling. Above‑ground stocks, equivalent to a year’s global mine production, have dwindled for half a decade. This raises squeeze risks if investment demand surges – exacerbated by potential war‑related industrial slowdowns.
Federal Reserve signals of sustained restrictive rates (current fed funds at ~3.64% vs. 2.4% inflation) limit downside for silver by curbing rate‑cut bets. Markets still price roughly 50 basis points of cuts by year‑end. Stronger US jobs data and cautious Fed rhetoric reinforce this, indirectly pressuring opportunity costs for non‑yielding assets like silver.
US‑Iran tensions since late February 2026 have indirectly disrupted silver supply chains through sanctions, shipping risks, and energy cost spikes. Silver production, mostly as a copper/lead/zinc byproduct, faces compounded pressures from Iranian byproduct removal and global dependencies exposed by the Strait of Hormuz closure. Mining operations worldwide face surging diesel and electricity costs from oil at roughly $95 per barrel, slowing extraction and processing.
Read our latest report on the silver supply crisis.
Potential Chinese sulphuric acid export bans – critical for copper/silver leaching – threaten base metal output, indirectly curbing silver byproduct yields. Transportation uncertainties further delay concentrate movement to refineries. Trade barriers and tariffs strain equipment imports for Latin American mines and exports to the US and Europe. Currency volatility hits international miners. Manufacturing PMI drops signal reduced industrial demand for solar and electronics, but supply squeezes dominate the long‑term outlook.
Silver Price Prediction – Bullish, Bearish, and Likely Scenarios
 Bullish scenario: If the US‑Iran situation escalates into a full‑scale conflict, safe‑haven demand could push the silver price toward $100 within weeks. The supply chain disruptions would compound, and a Fed pivot to rate cuts would add fuel. In this case, silver could retest its 2026 high of $121 and eventually target $150.
 Bearish scenario: If peace talks resume and a lasting ceasefire is signed, geopolitical risk premium evaporates. Silver could drop back to test support at $72, then $68. A break below $65 would invalidate the bullish breakout structure and target $60.
 Most likely scenario (70% probability): Short‑term volatility will continue with every headline from the Middle East. Silver likely remains range‑bound between $75 and $85 for the next 1‑2 weeks, waiting for a catalyst. The structural deficit and central bank accumulation provide a floor near $72. Any dip below $75 should be viewed as a buying opportunity for long‑term holders. The breakout from the 12‑year base is intact, and Hajiyev’s “arrow” has not reversed.
FAQs

Silver could see short‑term dips due to geopolitical headlines or Fed rate hikes, but the structural deficit and breaking of a 12‑year base suggest any downside is limited, with strong support near $72.
Silver is rising because of six consecutive years of supply deficits, record industrial demand from solar and EVs, dwindling above‑ground stocks, and safe‑haven buying driven by US‑Iran tensions and global debt concerns.
Silver is used in solar panels, electric vehicles, electronics, medical devices, jewelry, and as a monetary asset; its unique conductivity and antibacterial properties make it irreplaceable in green technology and industrial applications.
Subscribe to our YouTube channel for daily crypto updates, market insights, and expert analysis.
The post Silver Price Forecast: US‑Iran Peace Talks Collapse Could Trigger a Precious Metals Sell‑Off appeared first on CaptainAltcoin.


You May Also Like

Things To Do In Hoi An (2026): 15 Best Activities & Travel Guide

Why XRP Price is Outperforming Bitcoin and Ethereum This Week?


