

Bitcoin Price Prediction as Crypto Fear and Greed Index Turns Green
Key Insights
- Bitcoin price is nearing the important resistance level at $80,000.
- The Crypto Fear and Greed Index has turned green this week.
- This rally is happening despite the rising crude oil prices and bond yields.
Bitcoin price remains in an upbeat tone this week. It crossed the important resistance level at $79,000 for the first time since February 3 this year. This rally may continue after forming an ascending triangle pattern and as the Crypto Fear and Greed Index jumps.
Bitcoin Price Optimism Rises as Crypto Fear and Greed Index Turns Green
Bitcoin price and other altcoins have done well this week. This happened as it emerged that investors are embracing a risk-on sentiment. This risk-on sentiment is also happening in the stock market. There, top indices like the S&P 500 and Nasdaq 100 are hovering near their all-time highs.
The Crypto Fear and Greed Index has been in an uptrend. It moved from the year-to-date low of 10 to the greed zone of 60 today.
This is an important metric that looks at various data points in the spot and futures markets. It looks at the market volatility, Bitcoin price action, and social media activity.
 Crypto Fear and Greed Index | Source: CoinMarketCap
Meanwhile, the broader Fear and Greed Index that CNN created has also turned green. It has also moved to the greed zone of 69. The S&P 500 and Nasdaq 100 have surged. They reached all-time highs for this reason.
The rising greed is also visible in the ETF market, where investors are moving back to crypto funds. Data shows that all spot Bitcoin ETFs have added over $1.87 billion in assets this month. That’s a big jump from the $1.32 billion they added in March.
The funds shed over $6.8 billion in assets in the previous four months. This happened as fear spread in the market and the coin dropped.
At the same time, whale investors have been accumulating Bitcoin in the past few weeks. This pushed their holdings to the highest level in months. The futures open interest has crossed the important resistance level of $60 billion. It’s much higher than the year-to-date low of $40 billion.
Digital Asset Treasury companies have also continued buying Bitcoin. With this, Strategy now has over 815,061 coins valued at over $63 billion. American Bitcoin added more coins this week and now holds 7,000.
Geopolitical Risks Have Pushed Bond Yields and Crude Oil Prices Higher
The ongoing greed is important as it is happening in a difficult period when US bond yields are rising and crude oil prices are in an uptrend. Brent has soared to $103, while the US benchmark rose to $94.
In a statement on Tuesday, President Donald Trump announced that he would offer Iran an extended ceasefire after the latter refused to meet with his team in Pakistan.
The risk, therefore, is that the ongoing ceasefire may lead to higher inflation and make it hard for the Federal Reserve to cut interest rates later this year as analysts were expecting earlier this year.
Bitcoin Price Technical Analysis
Technicals suggest that the BTC price may be on the cusp of a strong rally. This happened after bulls successfully defended the key support at $60,000.
It formed a double-bottom pattern between $60k and $64k and a neckline at $76,035. A double-bottom pattern mostly leads to more gains over time.
Bitcoin price has jumped above the 23.6% Fibonacci retracement level at $75,454. That confirmed the bullish outlook. It has also soared above the 50-day Exponential Moving Average (EMA).
The coin has flipped the Supertrend indicator from red to green. That’s a bullish sign in technical analysis. Also, the two lines of the MACD indicator have continued rising and already crossed the zero line.
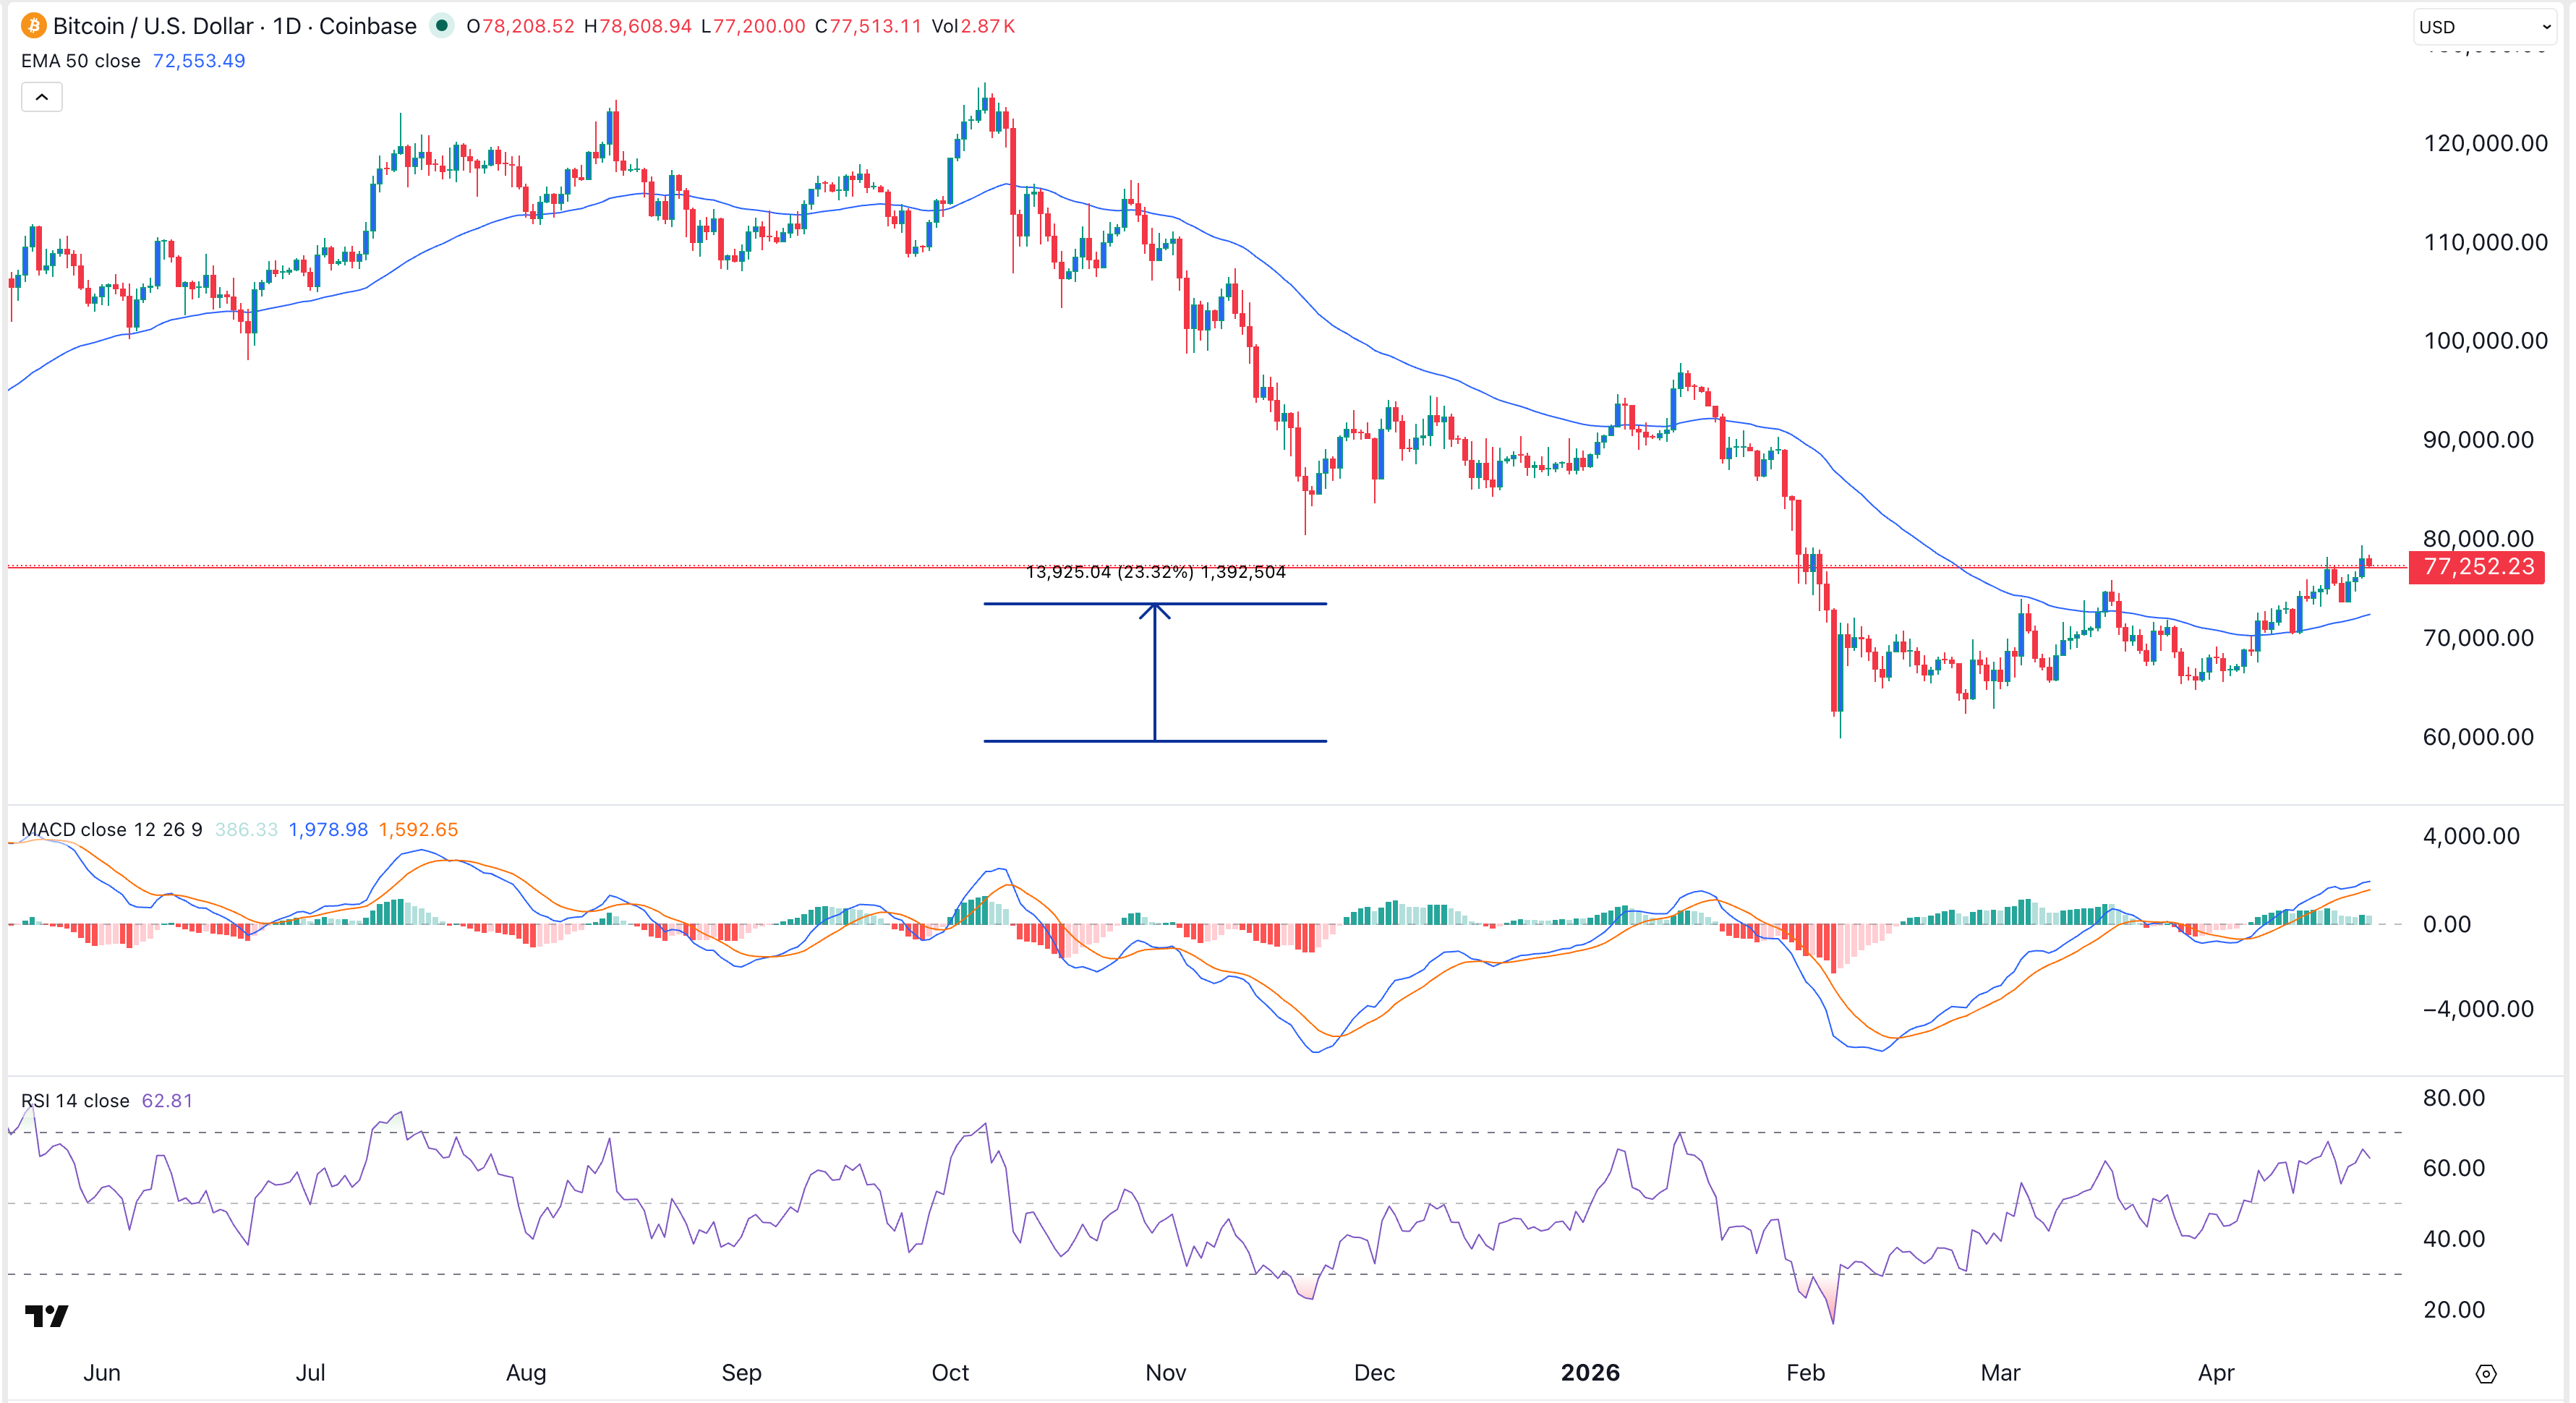 Bitcoin price chart | Source: TradingView
The Relative Strength Index has jumped to 63. Therefore, the coin will likely keep rising in the near term. With this, the next key target to watch is the 38.2% retracement level at $85,150. Soaring above that price will point to more gains, potentially to the key resistance level at $100k.
The post Bitcoin Price Prediction as Crypto Fear and Greed Index Turns Green appeared first on The Market Periodical.


You May Also Like

Trump retweet signals low priority for US-Iran peace deal, markets react

Trump endorses Israeli ceasefire, market shows 100% certainty


