

Bitcoin Resistance at $80K: Why BTC Faces Unyielding Barrier Amid Options Concentration
BitcoinWorld
Bitcoin Resistance at $80K: Why BTC Faces Unyielding Barrier Amid Options Concentration
Bitcoin faces persistent resistance near the $80,000 level, according to a recent Bloomberg report. The flagship cryptocurrency repeatedly tests this price point but fails to break through. Market observers point to a unique combination of factors holding BTC back.
Bloomberg Reports Bitcoin Resistance at $80K
Bloomberg’s analysis highlights a concentration of call option positions on Deribit. Approximately $1.5 billion in notional call options cluster at the $80,000 strike price. These options carry May and June expiration dates. Market makers, operating in a ‘long gamma’ environment, sell into rallies. This selling pressure limits upward momentum.
The report also notes weakening futures positions. Open interest in Bitcoin futures has declined in recent weeks. Spot demand shows signs of slowing. Profit-taking activity adds another layer of resistance. Together, these factors create a formidable barrier for Bitcoin.
Understanding the Options Market Dynamics
Options market mechanics play a central role in Bitcoin’s current price action. When market makers hold long gamma positions, they hedge by selling the underlying asset as prices rise. This creates natural selling pressure at key strike prices. The $80,000 level represents a significant concentration of open interest.
Data from Deribit confirms this pattern. The $1.5 billion notional value represents a large pool of contracts. These options expire in May and June 2025. Traders who sold these calls must manage their risk. They do so by selling Bitcoin futures or spot BTC when prices approach $80,000.
Key Levels to Watch
- $80,000: Immediate resistance with heavy options concentration
- $75,000: Support level tested multiple times in April
- $82,500: Next resistance if $80K breaks
- $70,000: Major support from February 2025 lows
Futures Market Weakness
Bitcoin futures markets show declining momentum. Open interest across major exchanges has dropped approximately 12% since mid-April. Funding rates turned negative on several occasions. This indicates reduced speculative appetite. Perpetual swap volumes also decreased. Traders appear cautious at current levels.
The CME Bitcoin futures premium narrowed significantly. This suggests institutional demand is cooling. Basis trades, which profit from price differences between spot and futures, offer lower returns. Market makers reduced their long positions. This further weakens the upward push.
Spot Demand Slows
Spot market activity shows similar weakness. Trading volumes on major spot exchanges declined over the past two weeks. The Coinbase premium, which measures buying pressure from US investors, turned negative. This indicates that American buyers are not aggressively accumulating at current prices.
Stablecoin inflows to exchanges also decreased. This metric often signals upcoming buying pressure. When stablecoins flow into exchanges, traders prepare to purchase Bitcoin. The recent decline suggests reduced buying intent. Accumulation addresses, which hold BTC without spending, show slower growth rates.
Profit-Taking Pressure
Long-term holders are taking profits near the $80,000 level. On-chain data reveals increased spending from wallets that held Bitcoin for over 155 days. The Spent Output Profit Ratio (SOPR) remains above 1, indicating that most spent coins are profitable. This creates natural selling pressure as holders realize gains.
The MVRV ratio, which compares market value to realized value, sits at elevated levels. Historical patterns show that profit-taking intensifies when this ratio exceeds certain thresholds. Current readings suggest that many holders consider $80,000 a fair exit point.
Historical Context of Bitcoin Resistance Levels
Bitcoin has a history of forming resistance at round numbers. The $10,000, $20,000, and $50,000 levels all presented similar challenges. Each required multiple attempts before breaking. The $80,000 level follows this pattern. Psychological barriers often coincide with options concentration.
Previous resistance levels took weeks or months to overcome. The $50,000 level, for example, held for nearly three months in 2024. Breakouts typically require a catalyst. This could be a macroeconomic shift, regulatory clarity, or institutional adoption news.
Timeline of Recent Resistance Levels
| Price Level | Time to Break | Key Catalyst |
|---|---|---|
| $50,000 | 3 months | ETF approval expectations |
| $60,000 | 6 weeks | Institutional buying wave |
| $70,000 | 4 weeks | Halving event anticipation |
| $80,000 | Ongoing | Unknown |
Expert Perspectives on Bitcoin’s Path Forward
Market analysts offer mixed views on Bitcoin’s near-term trajectory. Some believe the resistance will break once options expire. The May and June expiration dates could remove the hedging pressure. Others argue that fundamental demand must increase first.
Options traders point to the ‘max pain’ theory. This concept suggests that prices gravitate toward levels where the most options expire worthless. For May expiration, max pain sits near $75,000. This could pull prices lower before the next rally attempt.
Institutional observers note that Bitcoin’s correlation with traditional markets remains relevant. If the S&P 500 continues its upward trend, risk appetite could spill over into crypto. Conversely, a stock market correction would likely drag Bitcoin lower.
Macroeconomic Factors at Play
Broader economic conditions influence Bitcoin’s price action. Interest rate expectations remain a key driver. The Federal Reserve’s stance on monetary policy affects all risk assets. Lower rates typically benefit Bitcoin. Higher rates create headwinds.
Inflation data released in April showed mixed signals. Core inflation remains above the Fed’s target. This reduces the likelihood of rate cuts in the near term. Dollar strength also pressures Bitcoin. A stronger dollar makes BTC less attractive to international investors.
Geopolitical events add uncertainty. Trade tensions between major economies could impact risk sentiment. Bitcoin sometimes acts as a hedge during geopolitical stress. However, this relationship is inconsistent.
On-Chain Metrics Provide Clues
Blockchain data offers additional insights. The number of active addresses declined slightly over the past week. Transaction counts remain stable but not growing. Hash rate continues to rise, indicating miner confidence. However, miner revenue from transaction fees dropped as network activity slowed.
The Bitcoin Fear and Greed Index sits in neutral territory. This suggests that market sentiment is not extreme in either direction. Historically, major moves occur when sentiment reaches extreme levels. The current neutral reading implies that a catalyst is needed to spark the next trend.
What Traders Should Watch
Several key indicators will determine Bitcoin’s next move. First, monitor options open interest at $80,000. A decline in this concentration would reduce resistance. Second, watch futures funding rates. Sustained negative rates could signal a bottom. Third, track stablecoin inflows to exchanges. An increase would suggest renewed buying interest.
Volume analysis is also important. A breakout above $80,000 on high volume would be bullish. A rejection on low volume would confirm resistance. The relative strength index (RSI) on daily timeframes remains neutral. This leaves room for moves in either direction.
Conclusion
Bitcoin faces significant resistance near $80,000 due to options concentration, weakening futures, slowing spot demand, and profit-taking. The Bloomberg report highlights these interconnected factors. Market makers selling into rallies create a self-reinforcing barrier. Options expiration in May and June could remove some pressure. However, broader market conditions and sentiment will ultimately determine Bitcoin’s path. Traders should monitor key levels and on-chain metrics for signs of a breakout or breakdown. The $80,000 level remains the most critical price point for Bitcoin in the coming weeks.
FAQs
Q1: Why is Bitcoin stuck at $80,000?
A: Bitcoin faces resistance at $80,000 due to a concentration of call options on Deribit, weakening futures positions, slowing spot demand, and profit-taking by long-term holders. Market makers sell into rallies, creating selling pressure.
Q2: What is ‘long gamma’ in options trading?
A: Long gamma refers to a position where the option’s delta changes rapidly with the underlying price. Market makers with long gamma must hedge by selling the asset as prices rise, which limits upward momentum.
Q3: How much Bitcoin options open interest is at $80,000?
A: Approximately $1.5 billion in notional call options are clustered at the $80,000 strike price on Deribit, with May and June 2025 expirations.
Q4: Could Bitcoin break above $80,000 soon?
A: A breakout is possible if options expire without major resistance, or if a catalyst like institutional buying or macroeconomic shifts emerges. However, current indicators suggest continued consolidation.
Q5: What on-chain metrics should I watch for a breakout?
A: Key metrics include options open interest at $80K, futures funding rates, stablecoin inflows to exchanges, and the Bitcoin Fear and Greed Index. High volume on a breakout would confirm strength.
This post Bitcoin Resistance at $80K: Why BTC Faces Unyielding Barrier Amid Options Concentration first appeared on BitcoinWorld.


You May Also Like
Cango Inc. Completes $65M Investment and Secures $10M Convertible Note Financing
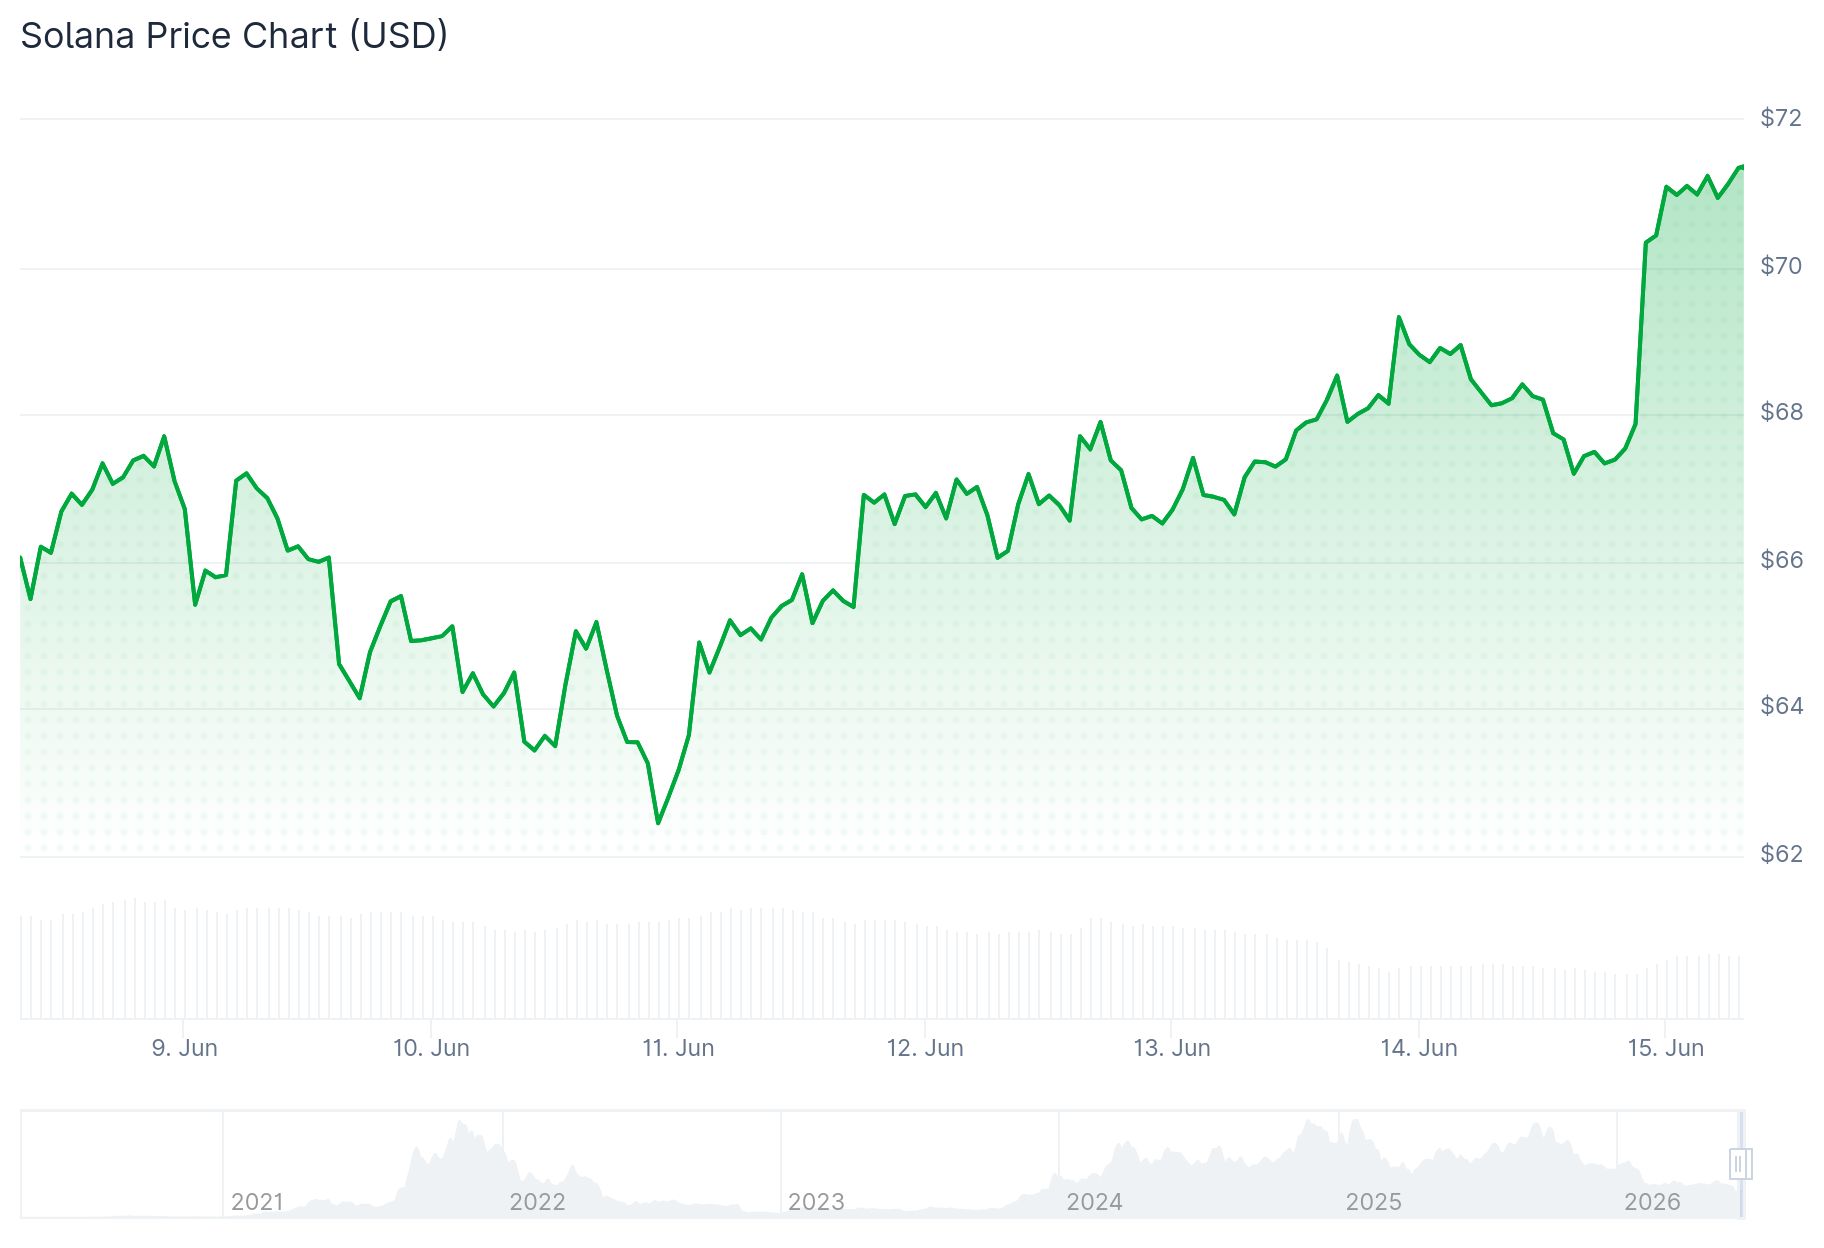
Solana (SOL) Price: SOL Flashing the Same Pattern That Started Its Last Bull Run

Western Star Resources Acquires Past-Producing Eagle Point Tungsten Mine in New Mexico, Highlighting Untested Exploration Targets


