

Crypto Fear & Greed Index Hits 39: Market Sentiment Plunges Into ‘Fear’ Zone
BitcoinWorld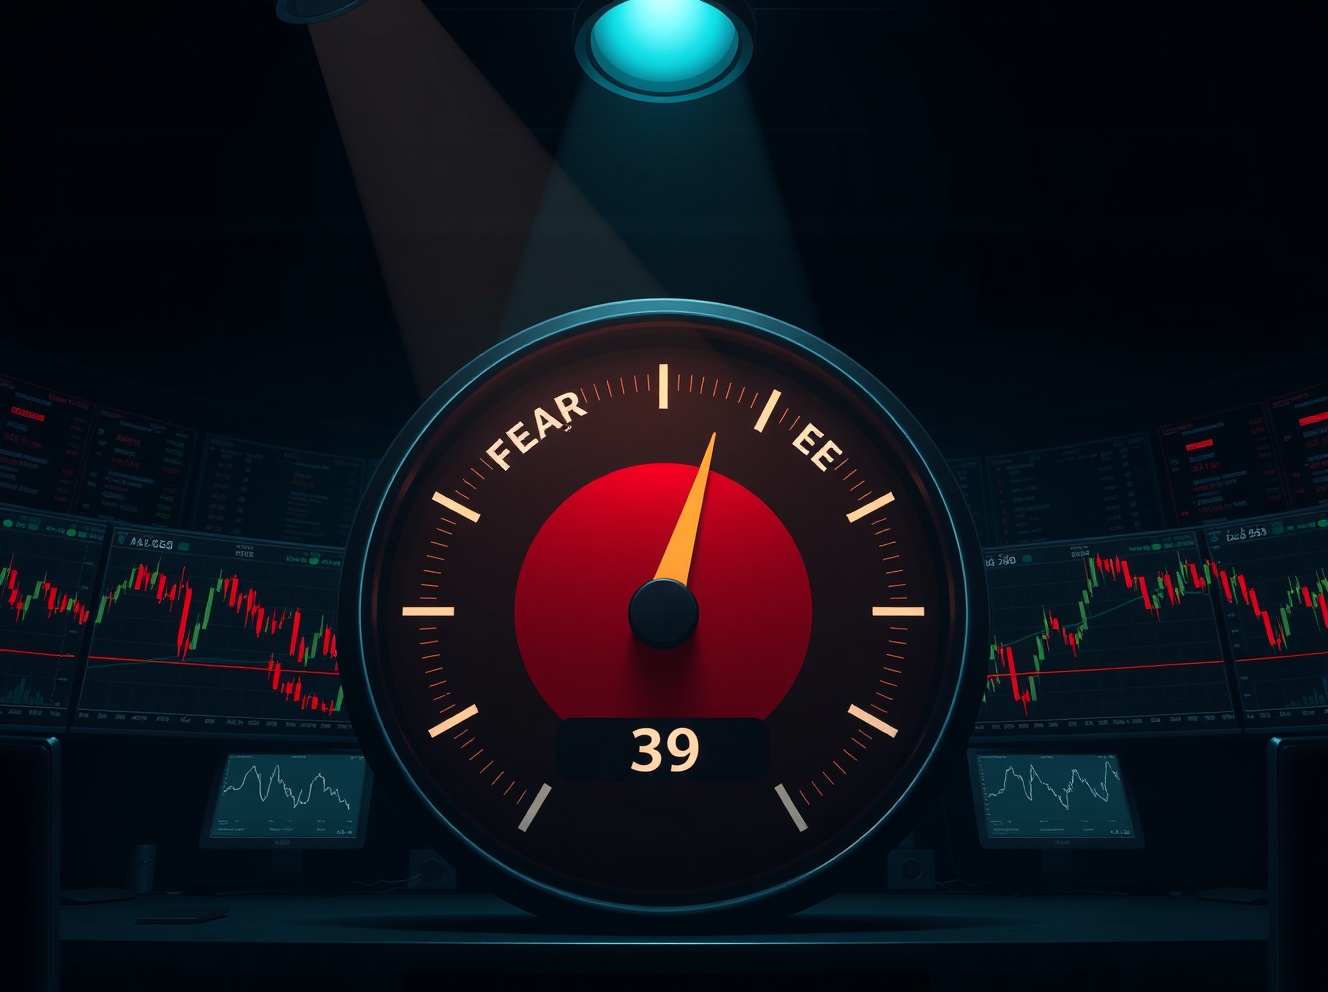
Crypto Fear & Greed Index Hits 39: Market Sentiment Plunges Into ‘Fear’ Zone
The Crypto Fear & Greed Index, a widely tracked barometer of investor emotion, has dropped two points to 39. This shift moves the market from a ‘neutral’ stance into ‘fear’ territory. The data, provided by CoinMarketCap, reflects a notable souring of sentiment among cryptocurrency traders and investors. This change signals growing caution and potential sell-off pressure across digital asset markets.
Understanding the Crypto Fear & Greed Index Drop to 39
The index operates on a simple scale. Zero represents ‘extreme fear,’ while 100 indicates ‘extreme greed.’ A reading of 39 places the market firmly in the fear zone. This marks a significant psychological shift. Just a day prior, the index sat at 41, still within the neutral band. The two-point decline might seem small, but it crosses a critical threshold. This threshold often triggers behavioral changes in market participants. Many traders use this index to gauge when to buy or sell. Historically, periods of fear can present buying opportunities for contrarian investors. Conversely, extreme greed often precedes market corrections.
Key Factors Driving the Shift in Investor Sentiment
CoinMarketCap calculates the index using several weighted factors. These factors provide a comprehensive view of market dynamics. The primary components include:
- Price Momentum: The index analyzes the price movements of the top 10 cryptocurrencies by market cap. Recent price declines in Bitcoin and major altcoins have contributed heavily to the negative reading.
- Market Volatility: Increased price swings create uncertainty. The index measures current volatility against historical averages. Higher volatility typically pushes the index toward fear.
- Derivatives Data: The put/call ratio for Bitcoin options provides insight. A higher ratio of puts (bearish bets) to calls (bullish bets) indicates defensive positioning by traders.
- Stablecoin Supply Ratio (SSR): This metric tracks the supply of stablecoins relative to Bitcoin’s market cap. A rising SSR suggests that investors are moving capital into stablecoins, a risk-off move.
- Search Data: CoinMarketCap uses its own search volume trends. Increased searches for ‘sell Bitcoin’ or ‘crypto crash’ versus ‘buy Bitcoin’ contribute to a fear reading.
Market Impact of the Fear & Greed Index at 39
When the index enters fear territory, several predictable market behaviors often emerge. First, retail investors tend to panic sell. This can exacerbate downward price pressure. Second, trading volumes on exchanges typically spike. Investors rush to exit positions or hedge against further losses. Third, the demand for stablecoins like USDT and USDC increases. This flight to safety reduces liquidity in the spot market. However, seasoned investors often view fear as a potential entry point. The adage ‘be fearful when others are greedy, and greedy when others are fearful’ is frequently cited. Data from previous cycles shows that buying during fear phases can yield strong returns over the long term.
Historical Context: Fear Readings and Market Bottoms
Examining past instances of the index at 39 or lower provides useful context. In mid-2022, the index spent weeks below 20 during the Terra LUNA collapse. That period marked a generational bottom for many assets. In late 2023, the index briefly touched 30 as Bitcoin recovered from its lows. Each time, the market eventually rebounded. However, the duration of the fear phase varies. Some fear periods last only a few days. Others can persist for months during prolonged bear markets. The current reading of 39 suggests uncertainty but not capitulation. A drop below 25 would indicate extreme fear and potentially a more significant bottoming process.
Bitcoin Sentiment and Broader Market Correlation
Bitcoin sentiment heavily influences the overall index. As the largest cryptocurrency, Bitcoin’s price action drives the majority of the calculation. Recent Bitcoin price declines below key support levels have spooked investors. The asset has faced resistance at $70,000 and pulled back to the mid-$60,000 range. This price action, combined with regulatory headlines and macroeconomic uncertainty, has soured the mood. Altcoins have followed suit, with many experiencing double-digit percentage drops. The correlation between Bitcoin and the broader market remains strong. Until Bitcoin stabilizes, the index is likely to stay in fear territory.
Expert Analysis: What the Data Reveals About Trader Behavior
Market analysts point to several underlying causes for the shift. The put/call ratio on major exchanges has climbed. This indicates that professional traders are buying protection. The Stablecoin Supply Ratio has also increased. This suggests that capital is rotating out of volatile assets. Additionally, social media sentiment has turned negative. Fear, uncertainty, and doubt (FUD) are spreading across crypto forums. These behavioral signals often precede further downside in the short term. However, they also set the stage for a potential relief rally. The key question is whether the fear is overdone or justified by fundamentals.
Practical Implications for Crypto Investors
For individual investors, the index serves as a useful sentiment check. It helps avoid emotional decision-making. When the index is in fear, the natural instinct is to sell. But historical data suggests that disciplined accumulation during fear phases often pays off. Conversely, when the index reaches extreme greed, it may be time to take profits. The current reading of 39 does not scream ‘buy the dip’ as loudly as a reading of 20 would. But it does signal that the market is becoming less frothy. Investors should assess their own risk tolerance and time horizon before acting.
Conclusion
The Crypto Fear & Greed Index hitting 39 and shifting to ‘fear’ is a clear signal of changing market psychology. This move reflects real data points, including price declines, rising volatility, and defensive trader positioning. While fear can be uncomfortable, it often creates opportunities for disciplined investors. The index provides a valuable framework for understanding sentiment without relying on emotion. As the market digests current conditions, the index will continue to be a key tool for gauging the mood of the crypto ecosystem. Investors should monitor it closely alongside other fundamental and technical indicators.
FAQs
Q1: What does a Crypto Fear & Greed Index reading of 39 mean?
A reading of 39 means the market is in a state of ‘fear.’ It suggests that investors are pessimistic and that selling pressure may be increasing. Historically, this can be a sign of a potential market bottom or a period of consolidation.
Q2: How is the Crypto Fear & Greed Index calculated?
CoinMarketCap calculates the index using five weighted factors: price momentum of the top 10 cryptocurrencies, market volatility, derivatives data (put/call ratios), the Stablecoin Supply Ratio (SSR), and its own search data.
Q3: Should I buy or sell when the index is at 39?
The index is a sentiment tool, not a trading signal. A fear reading may indicate a buying opportunity for long-term investors, but it does not guarantee a price bottom. Always conduct your own research and consider your risk tolerance.
Q4: How often does the Crypto Fear & Greed Index update?
The index updates daily. CoinMarketCap publishes a new reading each day based on the previous day’s data. This allows investors to track sentiment changes in near real-time.
Q5: Is the Crypto Fear & Greed Index reliable?
The index is a widely followed metric but should not be used in isolation. It provides a useful snapshot of market sentiment but does not predict future price movements. Combine it with technical analysis, on-chain data, and fundamental research for a complete picture.
This post Crypto Fear & Greed Index Hits 39: Market Sentiment Plunges Into ‘Fear’ Zone first appeared on BitcoinWorld.


You May Also Like

One Of Frank Sinatra’s Most Famous Albums Is Back In The Spotlight

Not a loophole: Singapore AI export controls let China tap US AI legally

LIST: Bayanihan initiatives amid soaring oil prices



