Solana (SOL) Faces Sixth Rejection at $90 — Could $50 Be the Next Target?
Key Takeaways
- Solana has declined 33% in 2025, ranking as the weakest performer among the top five cryptocurrencies
- On-chain transaction volume has fallen for nine straight weeks, now sitting 32% below recent highs
- Price action shows six failed attempts to break above $90, with SOL trapped in a $77–$90 range
- The weekly RSI indicator crossed its signal line in mid-April, mirroring a 2022 pattern that preceded a 2,400% surge
- Historical precedent suggests SOL may retrace to the low-to-mid $50s before resuming its uptrend
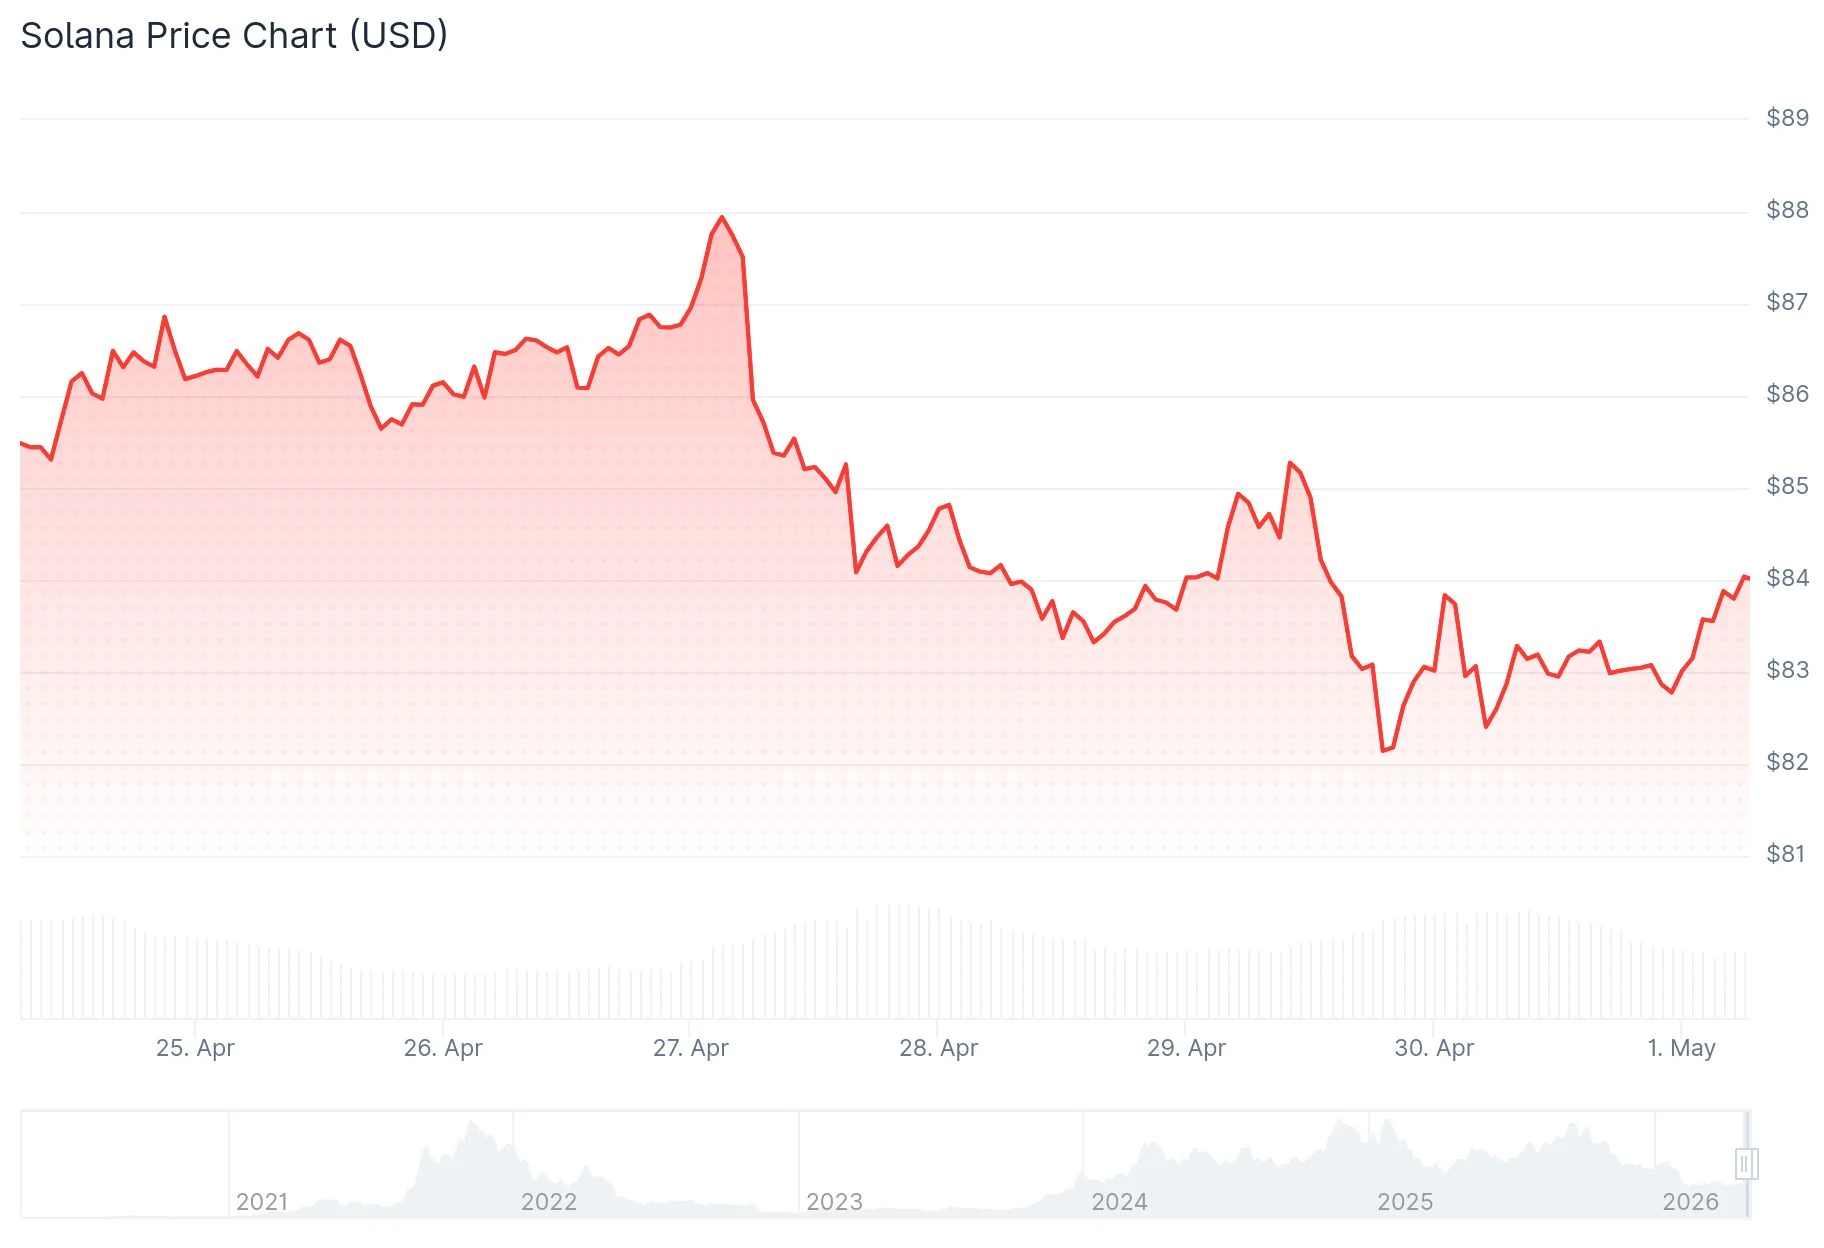
Solana (SOL) is currently hovering near $84 following a rebound from support at $81.40. The asset managed to reclaim ground above $83.50 and pierced through a descending trend line that had capped price action at $83.45 on the hourly timeframe.
 Solana (SOL) Price
This upward movement coincided with gains in both Bitcoin and Ethereum. SOL successfully climbed past the 50% Fibonacci retracement of its recent decline from $85.48 down to $81.40.
However, selling pressure persists beneath the $85 threshold. The immediate hurdle stands at $84.50, followed by a more significant barrier at $85.50. Bulls would need to push through $87 to establish momentum toward $92 and potentially $102.
Should SOL struggle to surpass $85.50, key support zones include $83.45, followed by $82.50, and then $81.40. A confirmed break below $81.40 would likely accelerate selling toward the $77 region.
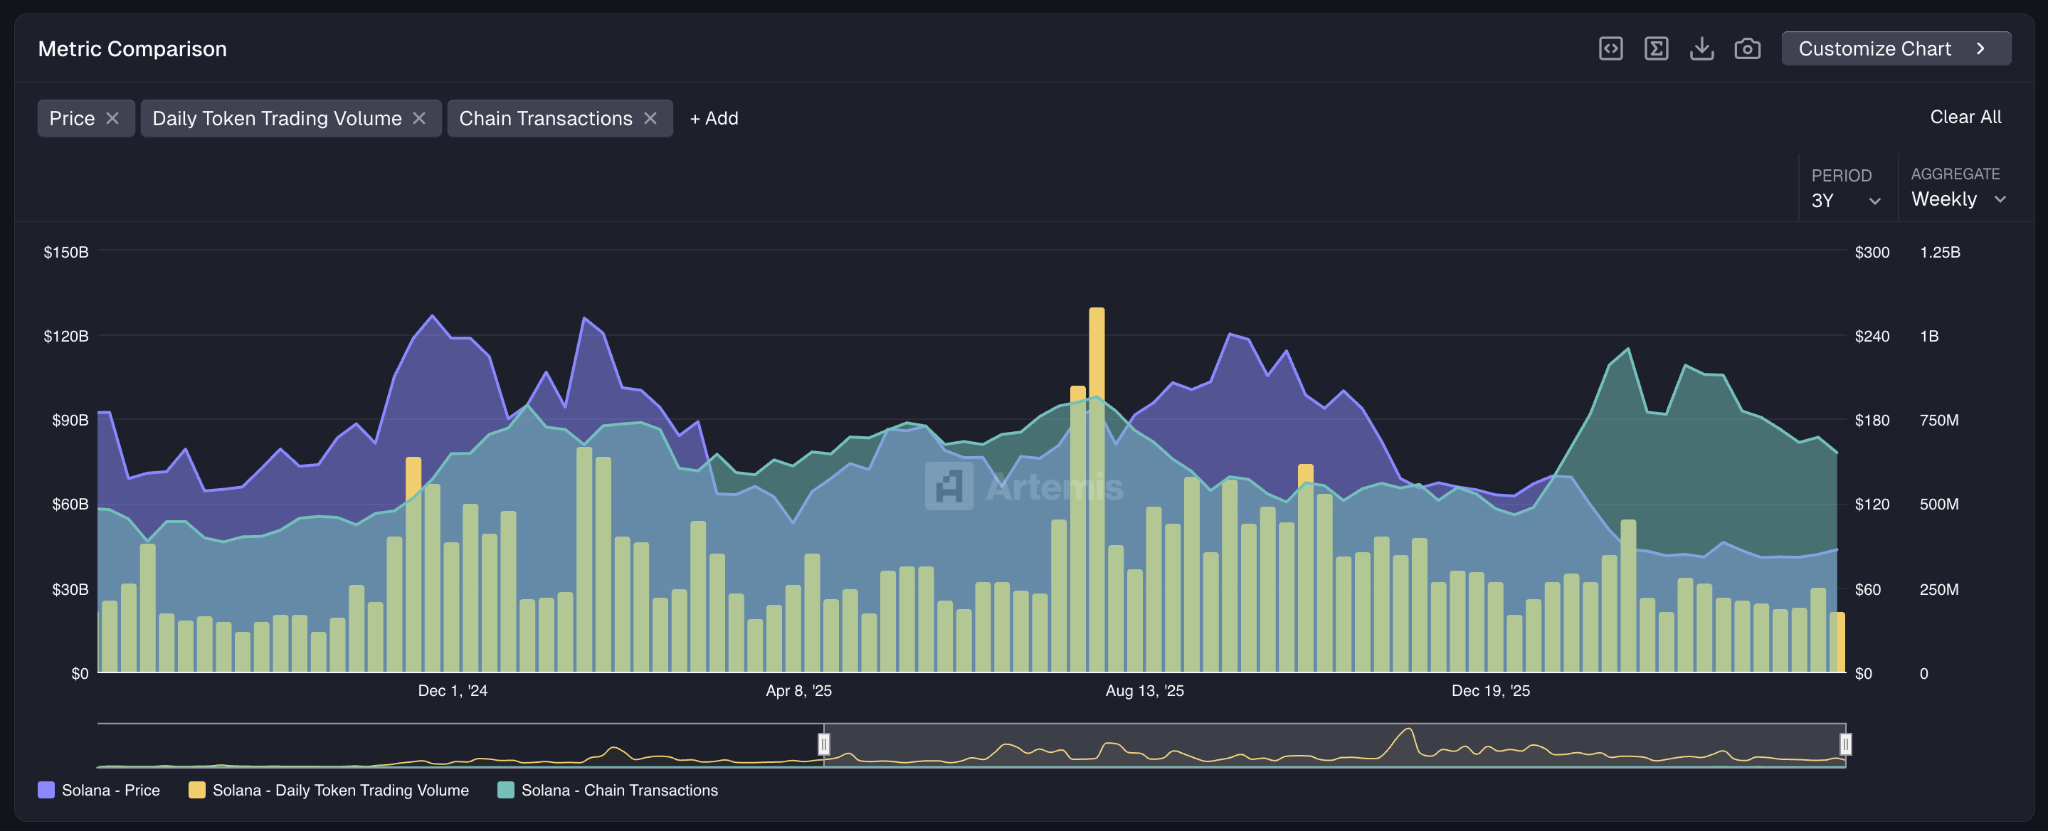
On-Chain Metrics Show Continued Weakness
Blockchain data paints a concerning picture for Solana. Transaction activity has contracted for nine weeks running, currently registering 32% lower than the 959 million transaction peak recorded in the week ending February 8.
 Source: Artemis
Trading activity has similarly diminished. The previous week registered $22 billion in SOL volume — roughly half the levels observed during the April–September 2025 bull cycle, and merely 20% of historical peaks.
Solana notably lagged during April’s market-wide rally. While Bitcoin posted 14% gains and Ethereum climbed 10%, SOL advanced just 2.8%.
For the year, Solana has tumbled 33%, establishing it as the poorest performer within the top five digital assets by market capitalization.
Macroeconomic Headwinds Compound Challenges
Broader economic factors are applying downward pressure on alternative cryptocurrencies. The PCE Price Index jumped from 2.8% in February to 3.5% in March, reflecting accelerating inflation primarily driven by surging energy prices. Crude oil has climbed back above $100 amid ongoing U.S. blockade actions in the Strait of Hormuz.
The Federal Reserve maintained its current interest rate position at the most recent meeting, with market expectations pointing to zero rate cuts throughout the remainder of the year. Jerome Powell delivered his concluding remarks as Fed Chair, while the FOMC exhibited visible disagreement regarding future monetary policy direction.
Investors are demonstrating clear risk aversion. Capital flows favor Bitcoin and Ethereum, leaving limited liquidity for alternative assets such as SOL.
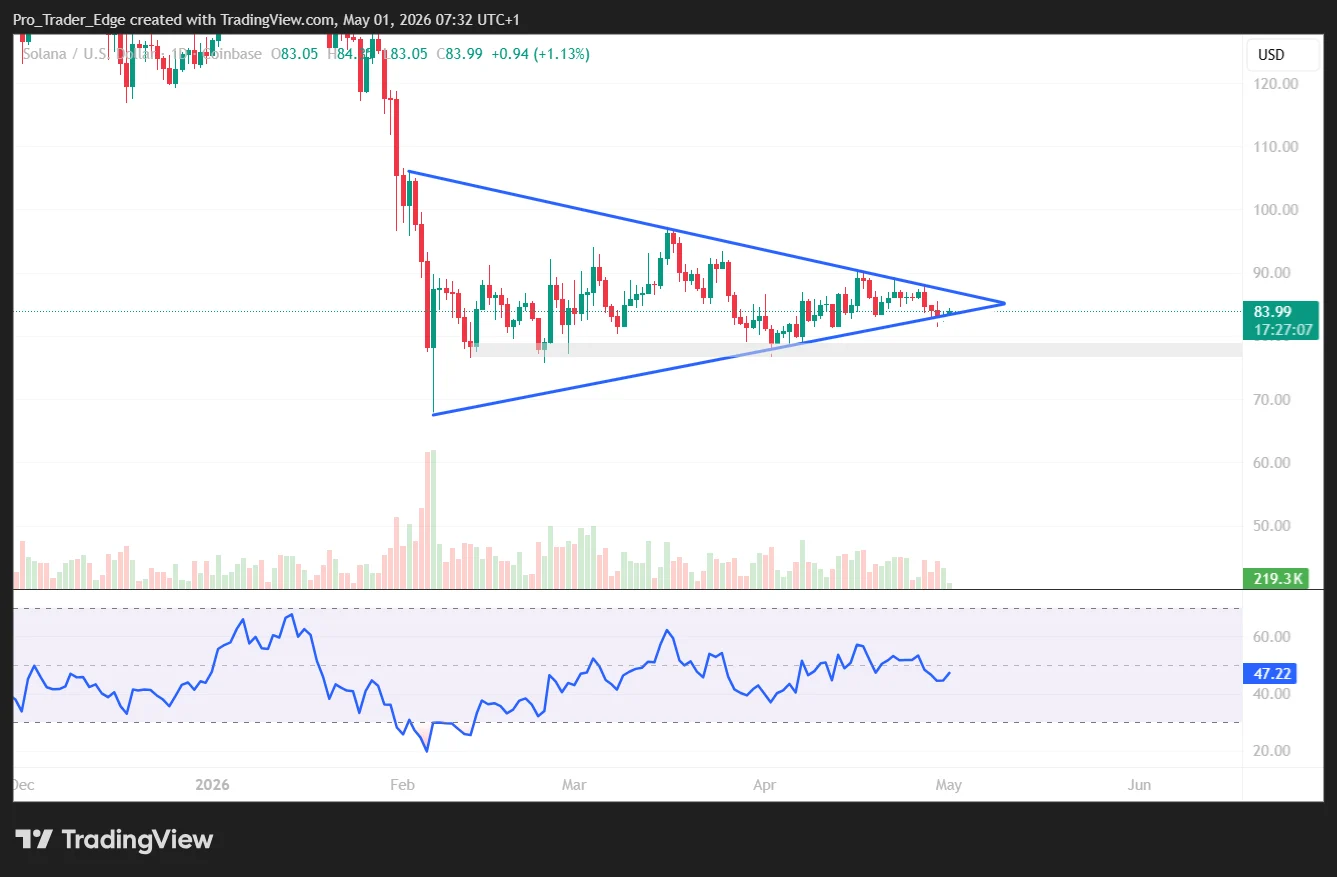
Technical Indicator Suggests Potential Correction to $50
Solana’s weekly RSI bottomed at 30 in February before crossing above its 14-week moving average during mid-April. This identical technical formation appeared in November 2022 — however, before the subsequent rally materialized, SOL first declined from $13 to $9.
 Source; TradingView
If this historical pattern repeats, Solana could experience a drawdown to the low-to-mid $50s before initiating its next substantial upward movement.
SOL has consolidated within a $77 to $90 channel for the past two months. Multiple bullish attempts to breach $90 have encountered aggressive resistance from sellers. The price structure remains locked in this consolidation phase.
The post Solana (SOL) Faces Sixth Rejection at $90 — Could $50 Be the Next Target? appeared first on Blockonomi.


You May Also Like

I Took a Calculated Risk and It Paid Off in a Big Way
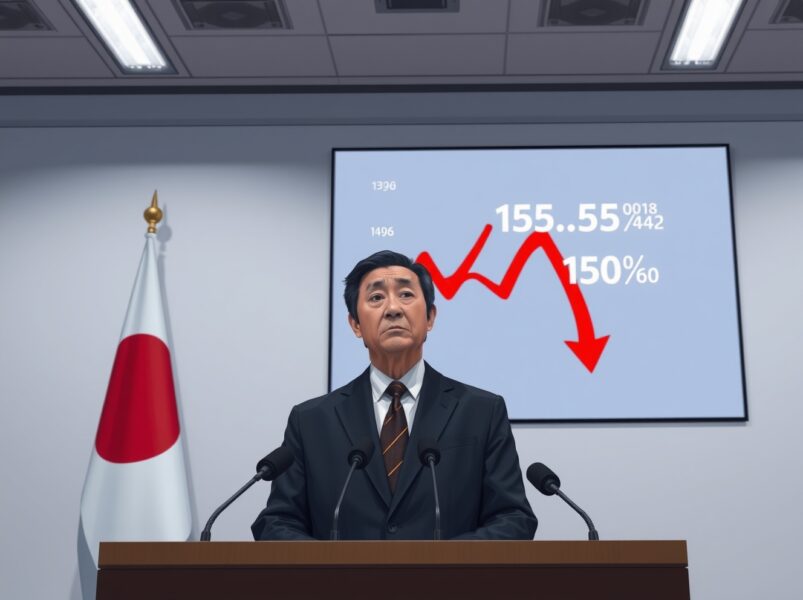
Japan Yen Intervention: Analysts Warn Weak Trend to Continue Despite Bold Action